the graph below is used by company 2 to show the average monthly electric cost based on the electricity…
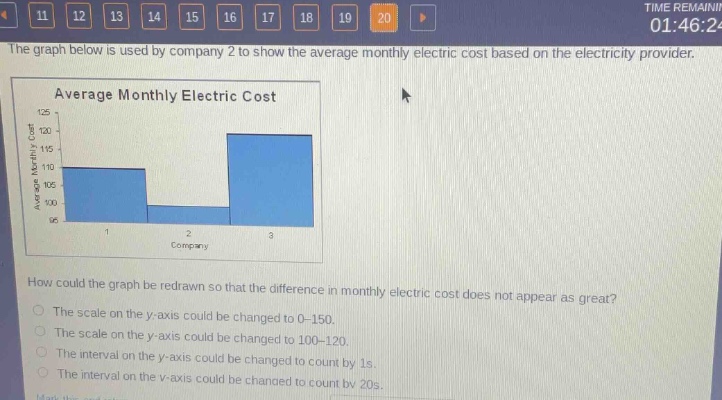
the graph below is used by company 2 to show the average monthly electric cost based on the electricity provider.\naverage monthly electric cost\nhow could the graph be redrawn so that the difference in monthly electric cost does not appear as great?\nthe scale on the y - axis could be changed to 0 - 150.\nthe scale on the y - axis could be changed to 100 - 120.\nthe interval on the y - axis could be changed to count by 1s.\nthe interval on the y - axis could be changed to count by 20s.
Answer
Explanation:
Step1: Analizar el eje - y actual
El eje - y actual va de 90 a 125 con intervalos de 5. Esto hace que la diferencia entre los costos eléctricos mensuales se vea más grande.
Step2: Considerar opciones
Si cambiamos el rango del eje - y a 0 - 150, el intervalo es más amplio y la diferencia entre los valores se verá menos pronunciada.
Step3: Analizar otras opciones
Si el rango es de 100 - 120, la diferencia se verá aún más grande. Si los intervalos son de 1s o 20s en el eje - y, no afecta directamente a la apariencia de la diferencia en los valores del eje - y.
Answer:
The scale on the y - axis could be changed to 0 - 150.