the graphs show why customers purchase flowers. which comparison is correct based on the graphs? a) a larger…
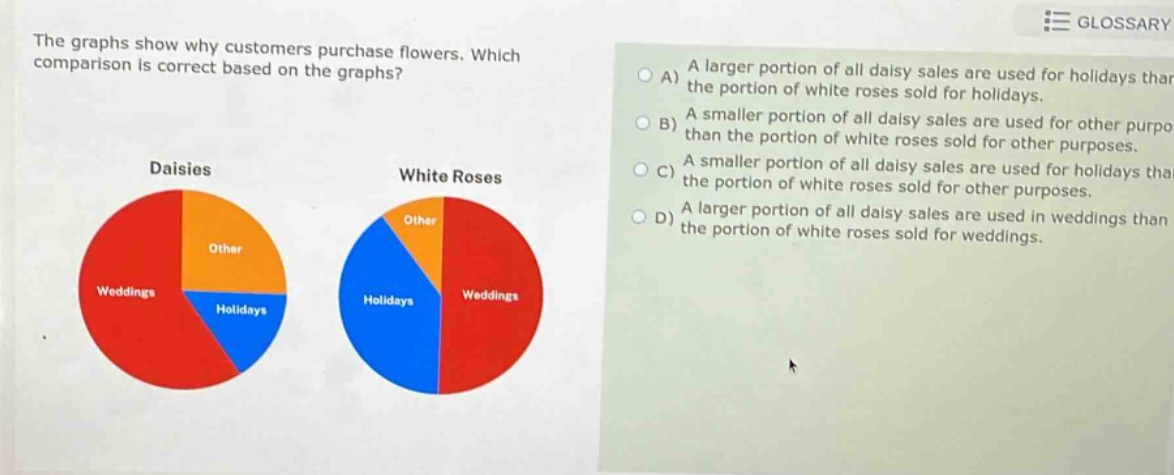
the graphs show why customers purchase flowers. which comparison is correct based on the graphs? a) a larger portion of all daisy sales are used for holidays than the portion of white roses sold for holidays. b) a smaller portion of all daisy sales are used for other purposes than the portion of white roses sold for other purposes. c) a smaller portion of all daisy sales are used for holidays than the portion of white roses sold for other purposes. d) a larger portion of all daisy sales are used in weddings than the portion of white roses sold for weddings.
Answer
Explanation:
Step1: Analyze option A
By observing the pie - charts, the portion of daisy sales for holidays is smaller than the portion of white - rose sales for holidays. So option A is incorrect.
Step2: Analyze option B
The portion of daisy sales for other purposes is larger than the portion of white - rose sales for other purposes. So option B is incorrect.
Step3: Analyze option C
The portion of daisy sales for holidays is smaller than the portion of white - rose sales for other purposes. This can be seen from the pie - charts.
Step4: Analyze option D
The portion of daisy sales for weddings is smaller than the portion of white - rose sales for weddings. So option D is incorrect.
Answer:
C