ice cream sales\nhow many sales on day 10?\nsales\ndays
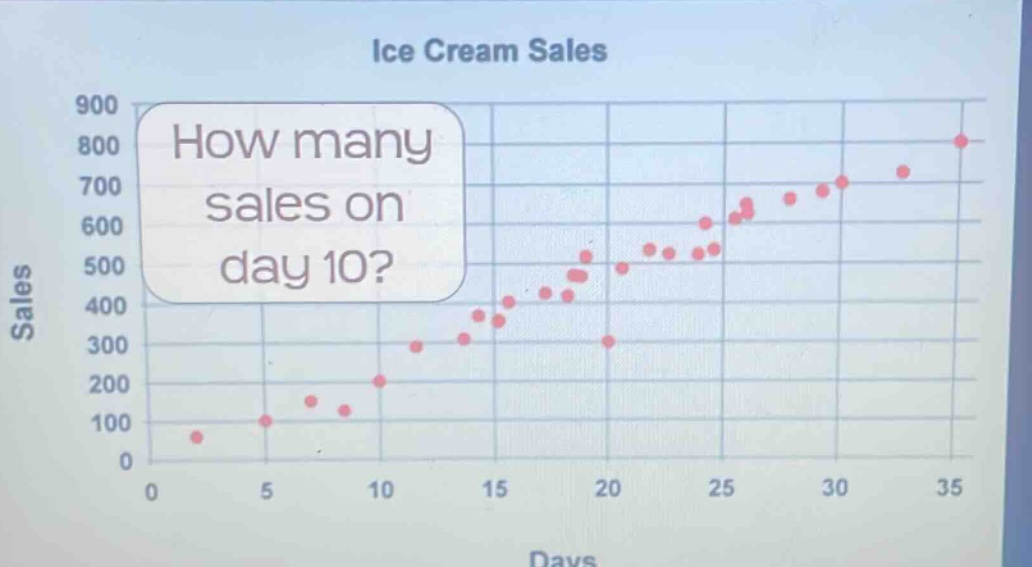
ice cream sales\nhow many sales on day 10?\nsales\ndays
Answer
Explanation:
Step1: Locate Day 10 on the X-axis
Find the value 10 on the horizontal axis labeled 'Days'.
Step2: Identify the Corresponding Data Point
Move vertically up from 10 on the x-axis to find the plotted point for day 10.
Step3: Read the Sales Value on the Y-axis
Trace horizontally from the data point to the vertical axis labeled 'Sales' to find the corresponding sales value. The point aligns with the 200 mark on the y-axis.
Answer:
200