which is the icon for a line chart?
which is the icon for a line chart?
Answer
Brief Explanations:
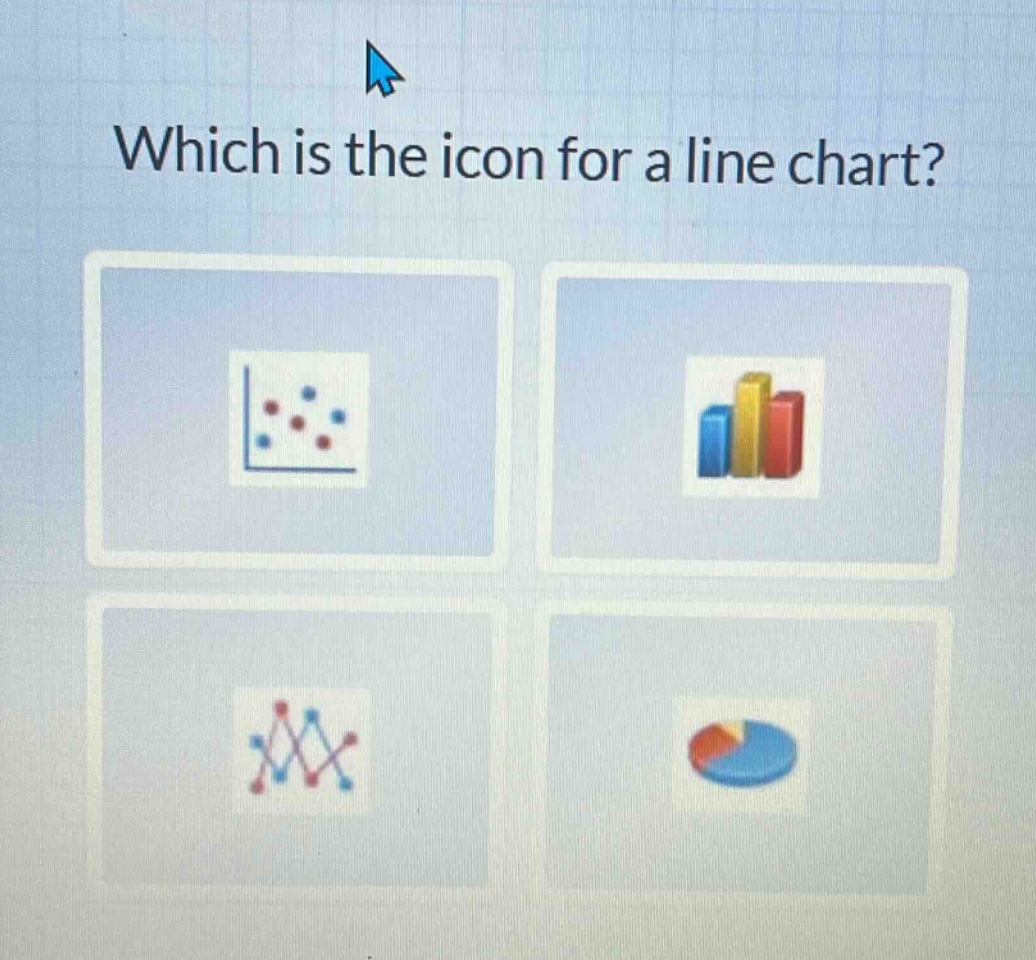
A line - chart icon typically shows connected lines representing data points over a variable (like time or another continuous variable). The first icon is a scatter - plot, the second is a bar - chart, the third shows connected lines which is characteristic of a line - chart, and the fourth is a pie - chart.
Answer:
The third icon (the one with connected lines)