at lakewood consulting, the head of human resources examined how the number of employees with health care…
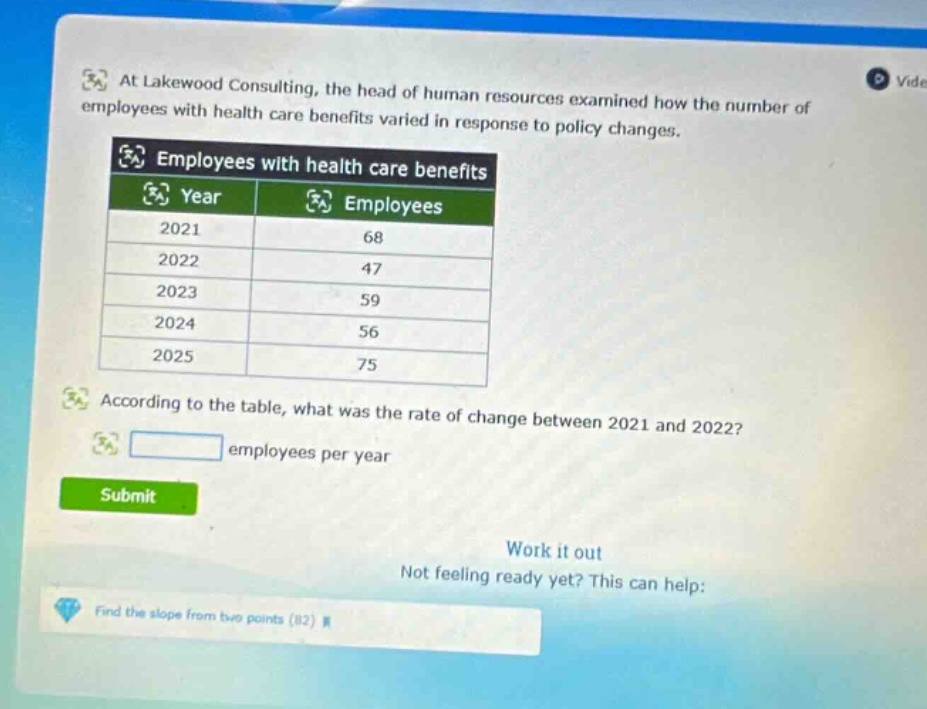
at lakewood consulting, the head of human resources examined how the number of employees with health care benefits varied in response to policy changes. employees with health care benefits year employees 2021 68 2022 47 2023 59 2024 56 2025 75 according to the table, what was the rate of change between 2021 and 2022? employees per year submit work it out not feeling ready yet? this can help: find the slope from two points (82)
Answer
Explanation:
Step1: Identify the formula for rate of change
The rate - of - change formula is $\frac{y_2 - y_1}{x_2 - x_1}$, where $(x_1,y_1)$ and $(x_2,y_2)$ are two points. Here, $x$ represents the year and $y$ represents the number of employees. For 2021 and 2022, $(x_1,y_1)=(2021,68)$ and $(x_2,y_2)=(2022,47)$.
Step2: Substitute values into the formula
$x_2 - x_1=2022 - 2021 = 1$, $y_2 - y_1=47 - 68=-21$. Then the rate of change is $\frac{47 - 68}{2022 - 2021}=\frac{-21}{1}=-21$.
Answer:
-21