monthly sales & advertising costs the scatterplot and trend line show a positive correlation between…
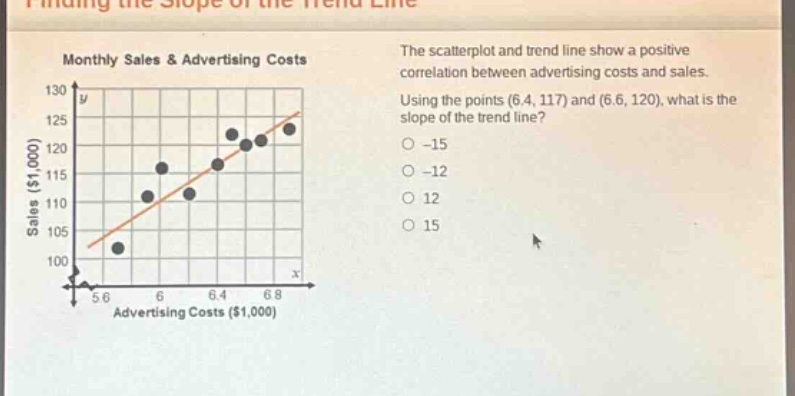
monthly sales & advertising costs the scatterplot and trend line show a positive correlation between advertising costs and sales. using the points (6.4, 117) and (6.6, 120), what is the slope of the trend line? -15 -12 12 15 sales ($1,000) 130 125 120 115 110 105 100 5.6 6 6.4 6.8 advertising costs ($1,000)
Answer
Explanation:
Step1: Recall slope - formula
The slope formula between two points $(x_1,y_1)$ and $(x_2,y_2)$ is $m=\frac{y_2 - y_1}{x_2 - x_1}$.
Step2: Identify the points
Let $(x_1,y_1)=(6.4,117)$ and $(x_2,y_2)=(6.6,120)$.
Step3: Substitute values into formula
$m=\frac{120 - 117}{6.6 - 6.4}=\frac{3}{0.2}=15$.
Answer:
15