monthly sales & advertising costs\nthe scatterplot and trend line show a positive correlation between…
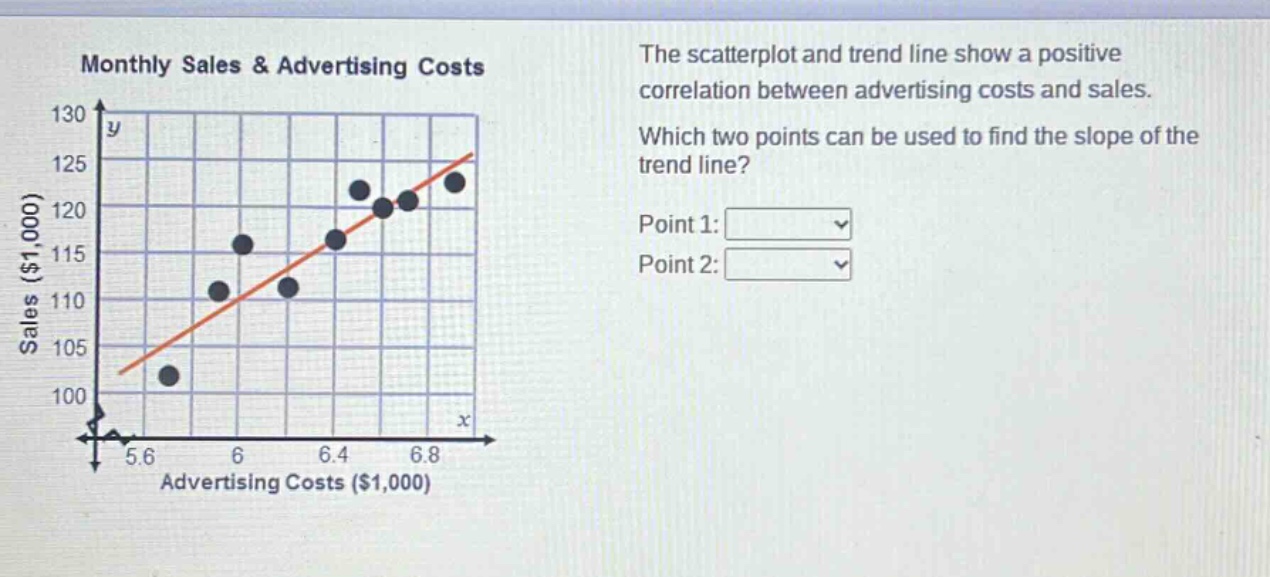
monthly sales & advertising costs\nthe scatterplot and trend line show a positive correlation between advertising costs and sales.\nwhich two points can be used to find the slope of the trend line?\npoint 1:\npoint 2:
Answer
Explanation:
Step1: Select two points on trend - line
We need to pick two clear points on the drawn trend - line.
Step2: Identify coordinates
Typically, we can choose the points where the trend - line intersects the grid lines clearly. For example, we can choose the point where $x = 6$ and $y\approx115$ and the point where $x = 6.8$ and $y\approx125$.
Answer:
Point 1: $(6, 115)$ Point 2: $(6.8, 125)$