monthly sales & advertising costs\nthe slope of the trend line is 15. what does that mean in regard to the…
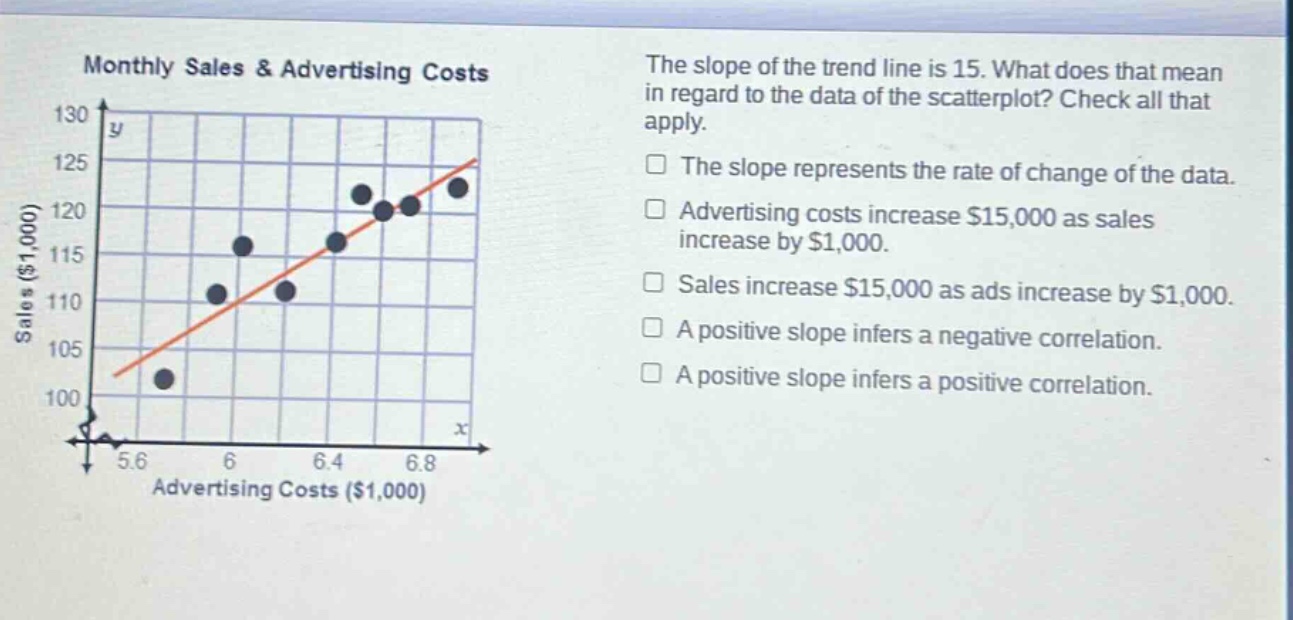
monthly sales & advertising costs\nthe slope of the trend line is 15. what does that mean in regard to the data of the scatterplot? check all that apply.\nthe slope represents the rate of change of the data.\nadvertising costs increase $15,000 as sales increase by $1,000.\nsales increase $15,000 as ads increase by $1,000.\na positive slope infers a negative correlation.\na positive slope infers a positive correlation.
Answer
Brief Explanations:
The slope in a scatter - plot represents the rate of change. A positive slope indicates a positive correlation, meaning as one variable (advertising costs here) increases, the other variable (sales) also increases. In this case, for every increase of $1,000 in advertising costs, sales increase by $15,000.
Answer:
The slope represents the rate of change of the data. Sales increase $15,000 as ads increase by $1,000. A positive slope infers a positive correlation.