one article states that each one - second delay in loading search results has the effect of multiplying the…
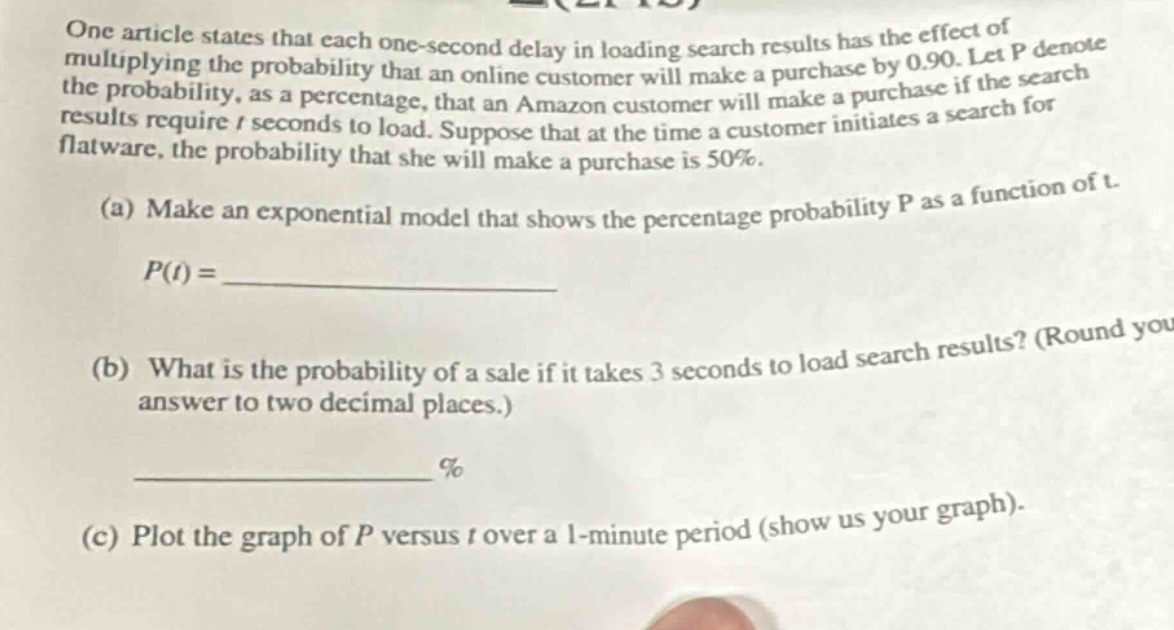
one article states that each one - second delay in loading search results has the effect of multiplying the probability that an online customer will make a purchase by 0.90. let p denote the probability, as a percentage, that an amazon customer will make a purchase if the search results require t seconds to load. suppose that at the time a customer initiates a search for flatware, the probability that she will make a purchase is 50%.(a) make an exponential model that shows the percentage probability p as a function of t.p(t) = ____________(b) what is the probability of a sale if it takes 3 seconds to load search results? (round your answer to two decimal places.)____________ % (c) plot the graph of p versus t over a 1 - minute period (show us your graph).
Answer
Explanation:
Step1: Identify the initial - value and decay factor
The initial probability when (t = 0) is (P(0)=50). The decay factor for each one - second delay is (0.90). The general form of an exponential decay model is (P(t)=P(0)\times r^{t}), where (P(0)) is the initial value and (r) is the decay factor.
Step2: Write the exponential model
Substitute (P(0) = 50) and (r = 0.90) into the general form. So (P(t)=50\times(0.90)^{t}).
Step3: Calculate the probability when (t = 3)
Substitute (t = 3) into the function (P(t)=50\times(0.90)^{t}). We have (P(3)=50\times(0.90)^{3}=50\times0.729 = 36.45).
Answer:
(a) (P(t)=50\times(0.90)^{t}) (b) (36.45) (c) To plot the graph of (y = P(t)=50\times(0.90)^{t}) over a 1 - minute ((t) from (0) to (60)) period, we can use a graphing utility. The function is an exponential decay function. When (t = 0), (y = 50). As (t) increases, the value of (y) decreases. For example, when (t = 1), (y=50\times0.90 = 45); when (t = 2), (y = 50\times(0.90)^{2}=40.5) and so on. The graph will start at the point ((0,50)) and approach the (t) - axis as (t) goes to (60).