what is the pattern displayed in the scatterplot between the number of cups of hot tea sold and the air…
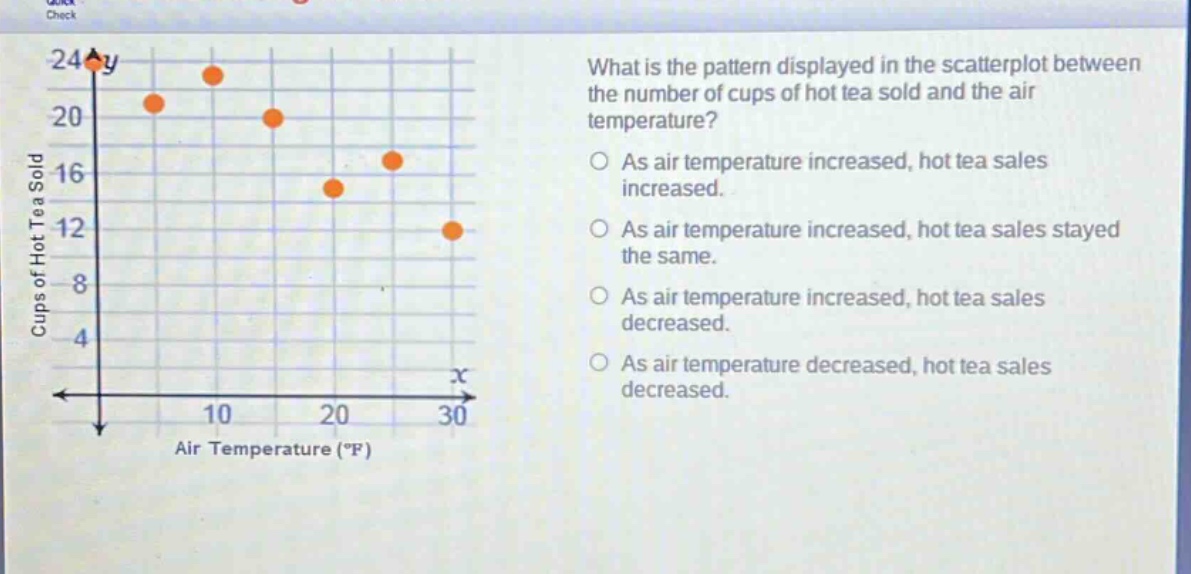
what is the pattern displayed in the scatterplot between the number of cups of hot tea sold and the air temperature?\nas air temperature increased, hot tea sales increased.\nas air temperature increased, hot tea sales stayed the same.\nas air temperature increased, hot tea sales decreased.\nas air temperature decreased, hot tea sales decreased.
Answer
Brief Explanations:
By observing the scatter - plot, as the air temperature (x - axis) increases from left to right, the number of cups of hot tea sold (y - axis) decreases.
Answer:
As air temperature increased, hot tea sales decreased.