santiago sells hot chocolate at the sledding hill in plainsview park. this scatter plot shows the afternoon…
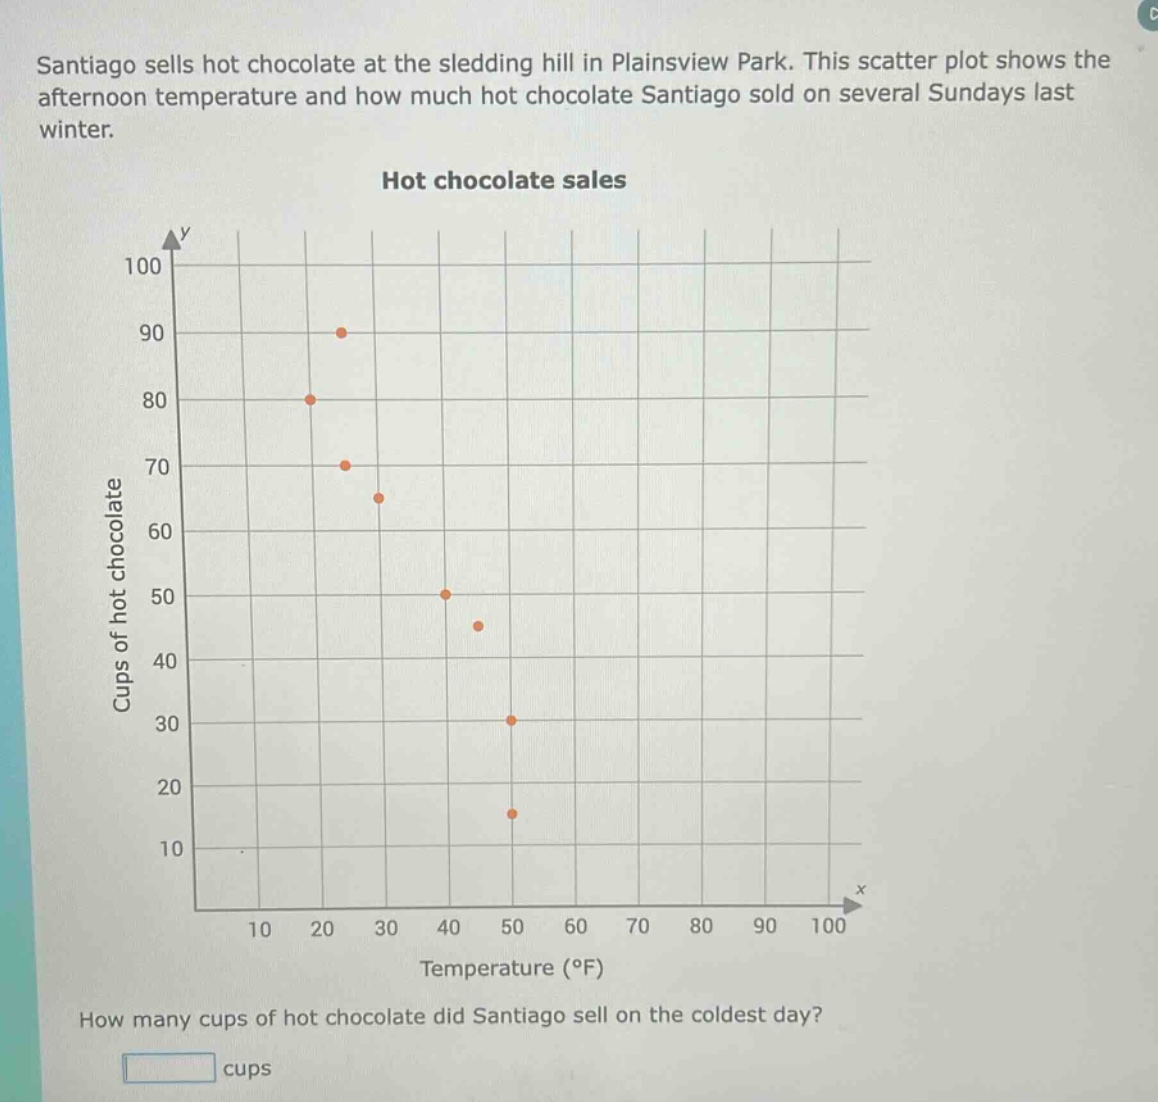
santiago sells hot chocolate at the sledding hill in plainsview park. this scatter plot shows the afternoon temperature and how much hot chocolate santiago sold on several sundays last winter. hot chocolate sales how many cups of hot chocolate did santiago sell on the coldest day? cups
Answer
Explanation:
Step1: Identify the coldest - temperature point
The x - axis represents temperature. The lowest value on the x - axis among the data points is around 20°F.
Step2: Find the corresponding y - value
The y - axis represents the number of cups of hot chocolate sold. For the point with an x - value of around 20°F, the y - value is 80.
Answer:
80