these scatterplots represent the monthly sales and advertising costs of a company. which trend line is the…
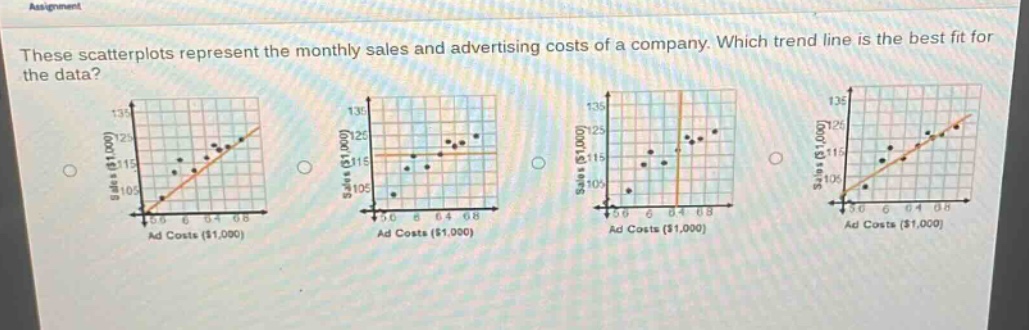
these scatterplots represent the monthly sales and advertising costs of a company. which trend line is the best fit for the data?
Answer
Explanation:
Step1: Recall best - fit line concept
A best - fit line should pass as close as possible to most of the data points in a scatter - plot.
Step2: Analyze each scatter - plot
In the first scatter - plot, the line appears to pass close to most of the data points, minimizing the vertical distances between the points and the line. In the second scatter - plot, the line does not capture the upward trend well. In the third scatter - plot, the vertical line is not a proper representation of the relationship between sales and advertising costs. In the fourth scatter - plot, the line does not seem to fit the data as well as the first one, with some points being far from the line.
Answer:
The first scatter - plot's trend line is the best fit for the data.