section 1, module 2: reading and writing directions this is a practice test 12 mark for review which choice…
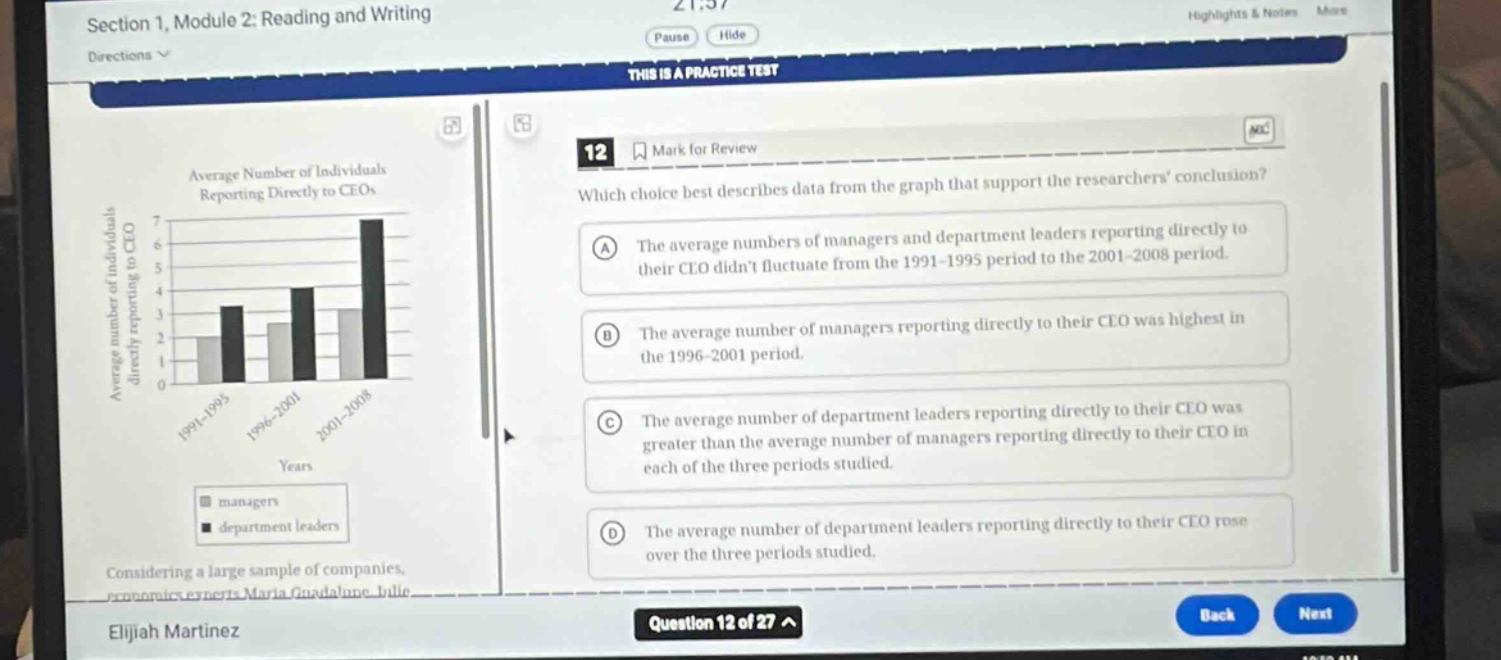
section 1, module 2: reading and writing directions this is a practice test 12 mark for review which choice best describes data from the graph that support the researchers conclusion? a the average numbers of managers and department leaders reporting directly to their ceo didnt fluctuate from the 1991 - 1995 period to the 2001 - 2008 period. b the average number of managers reporting directly to their ceo was highest in the 1996 - 2001 period. c the average number of department leaders reporting directly to their ceo was greater than the average number of managers reporting directly to their ceo in each of the three periods studied. d the average number of department leaders reporting directly to their ceo rose over the three periods studied. considering a large sample of companies, economic experts maria guadalupe julie elijah martinez question 12 of 27 back next
Answer
Answer:
D. The average number of department leaders reporting directly to their CEO rose over the three periods studied.
Explanation:
Step1: Analyze option A
In the graph, the numbers for managers and department - leaders change from 1991 - 1995 to 2001 - 2008, so A is wrong.
Step2: Analyze option B
The bar for managers is not highest in 1996 - 2001, so B is wrong.
Step3: Analyze option C
In 1991 - 1995, the number of managers is higher than department - leaders, so C is wrong.
Step4: Analyze option D
The height of the black bars (department leaders) increases from 1991 - 1995 to 2001 - 2008, so D is correct.