select the correct answer from each drop - down menu. the graphs below show the sales of touchless…
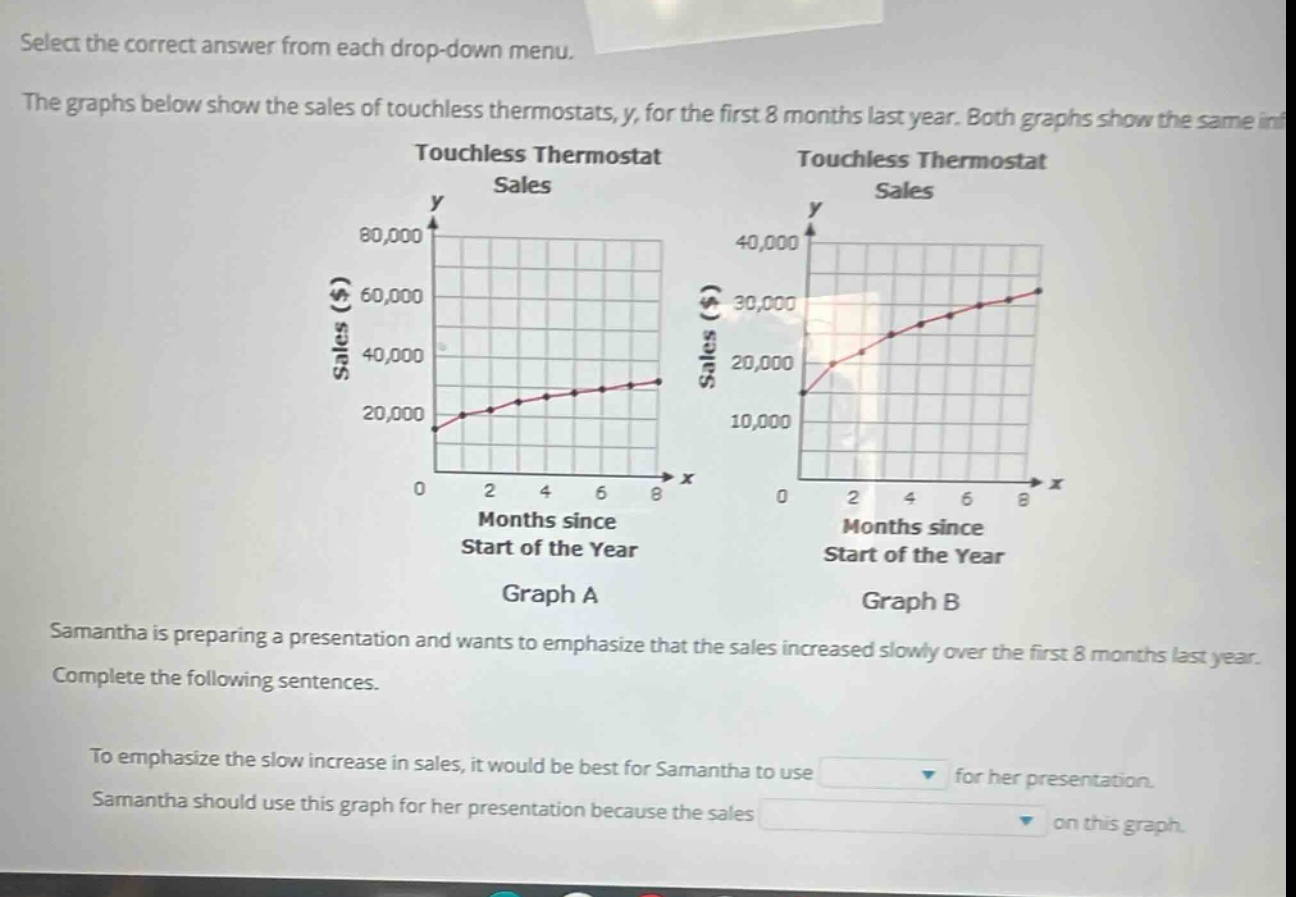
select the correct answer from each drop - down menu. the graphs below show the sales of touchless thermostats, y, for the first 8 months last year. both graphs show the same info. touchless thermostat sales touchless thermostat sales y y 80,000 40,000 60,000 30,000 sales ($) sales ($) 40,000 20,000 20,000 10,000 0 0 2 4 6 8 2 4 6 8 months since months since start of the year start of the year graph a graph b samantha is preparing a presentation and wants to emphasize that the sales increased slowly over the first 8 months last year. complete the following sentences. to emphasize the slow increase in sales, it would be best for samantha to use for her presentation. samantha should use this graph for her presentation because the sales on this graph.
Answer
Brief Explanations:
El gráfico A tiene una escala en el eje - y más amplia (hasta 80,000 dólares), lo que hace que la curva de crecimiento de las ventas parezca más suave y lenta. Mientras que el gráfico B tiene una escala en el eje - y más reducida (hasta 40,000 dólares), lo que hace que la curva de crecimiento de las ventas parezca más pronunciada.
Answer:
Para enfatizar el lento aumento en las ventas, sería mejor para Samantha usar Gráfico A para su presentación. Samantha debe usar este gráfico para su presentación porque las ventas parecen aumentar más lentamente en este gráfico.