select the correct answer from each drop - down menu. a merchandiser has to decide whether she should…
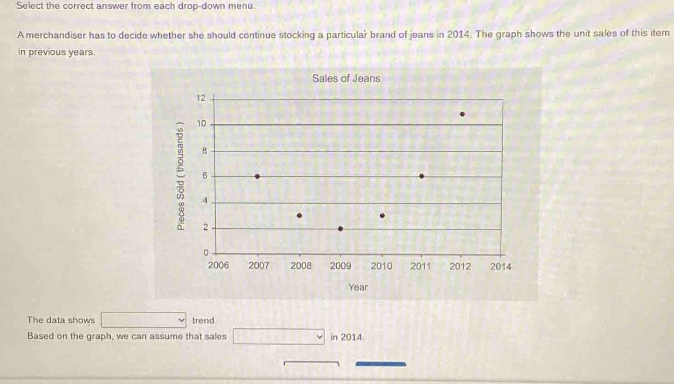
select the correct answer from each drop - down menu. a merchandiser has to decide whether she should continue stocking a particular brand of jeans in 2014. the graph shows the unit sales of this item in previous years. sales of jeans the data shows drop - down trend. based on the graph, we can assume that sales drop - down in 2014.
Answer
Explanation:
Step1: Analyze the graph
By observing the graph of sales of jeans from 2006 - 2012, we see that the number of pieces sold (in thousands) has an overall upward - movement. The sales values are 6 in 2006, 3 in 2007, 2 in 2008, 3 in 2009, 6 in 2010, 6 in 2011 and 10 in 2012.
Step2: Predict the trend
Since the sales have been increasing towards the end of the given time - period (2012), we can assume that the upward trend will continue.
Answer:
The data shows an upward trend. Based on the graph, we can assume that sales will increase in 2014.