select all the correct answers. a new technology company is marketing drones for residential use. the bar…
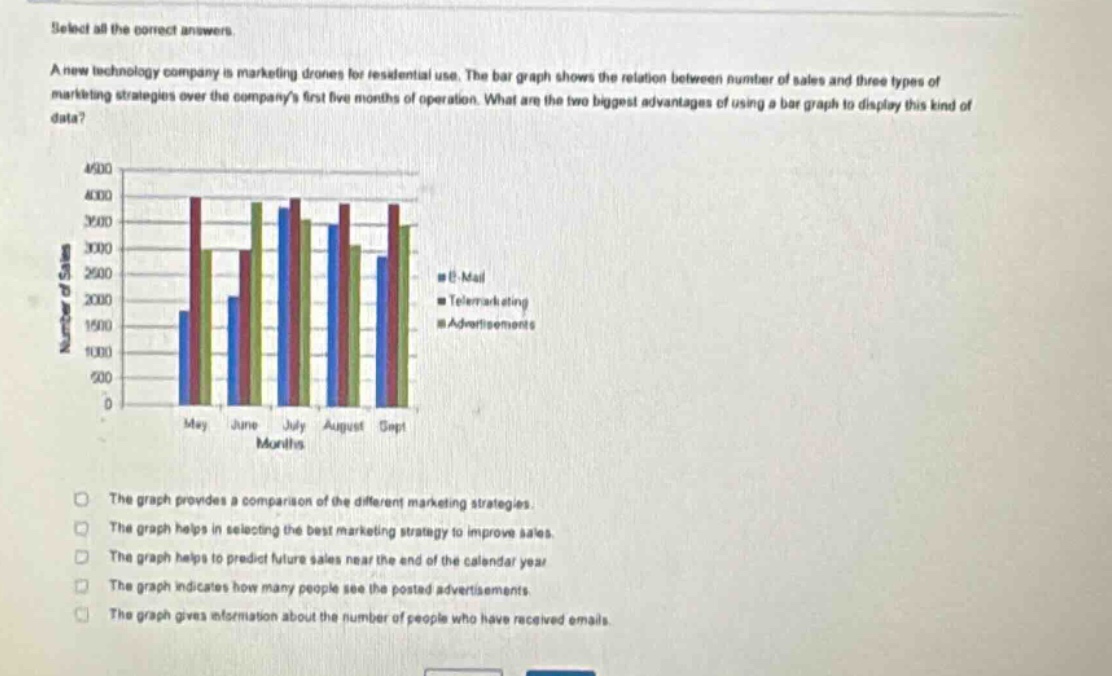
select all the correct answers. a new technology company is marketing drones for residential use. the bar graph shows the relation between number of sales and three types of marketing strategies over the companys first five months of operation. what are the two biggest advantages of using a bar graph to display this kind of data? the graph provides a comparison of the different marketing strategies. the graph helps in selecting the best marketing strategy to improve sales. the graph helps to predict future sales near the end of the calendar year. the graph indicates how many people see the posted advertisements. the graph gives information about the number of people who have received emails.
Answer
Brief Explanations:
Bar graphs are great for comparing data. In this case, it shows sales for different marketing - strategies over months. It can help in identifying the best - performing strategy for improving sales. It doesn't predict future sales accurately or give info about people seeing ads or receiving emails.
Answer:
The graph provides a comparison of the different marketing strategies. The graph helps in selecting the best marketing strategy to improve sales.