16. given the graph of f below, at what value(s) of x are both f and f both positive?
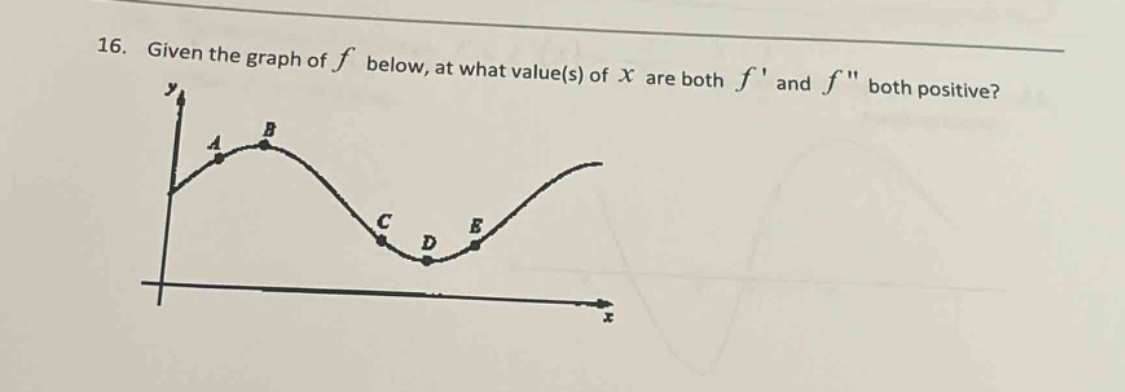
16. given the graph of f below, at what value(s) of x are both f and f both positive?
Answer
Explanation:
Step1: Recall derivative - slope relationship
The first - derivative (f^{\prime}(x)) represents the slope of the tangent line to the graph of (y = f(x)). If (f^{\prime}(x)>0), the function is increasing. Looking at the graph, the function is increasing when the tangent line has a positive slope. This occurs on the intervals where the graph is going up as we move from left to right.
Step2: Recall second - derivative - concavity relationship
The second - derivative (f^{\prime\prime}(x)) represents the concavity of the graph of (y = f(x)). If (f^{\prime\prime}(x)>0), the graph is concave up. A graph is concave up when it "holds water" or the tangent lines are rotating counter - clockwise as we move from left to right.
Step3: Analyze the graph
Between points (C) and (E), the function (y = f(x)) is increasing (so (f^{\prime}(x)>0)) and the graph is concave up (so (f^{\prime\prime}(x)>0)).
Answer:
The values of (x) for which both (f^{\prime}) and (f^{\prime\prime}) are positive are in the interval corresponding to the part of the graph between points (C) and (E).