17. given the graph of f below, at what value(s) of x is f = 0 and f < 0?
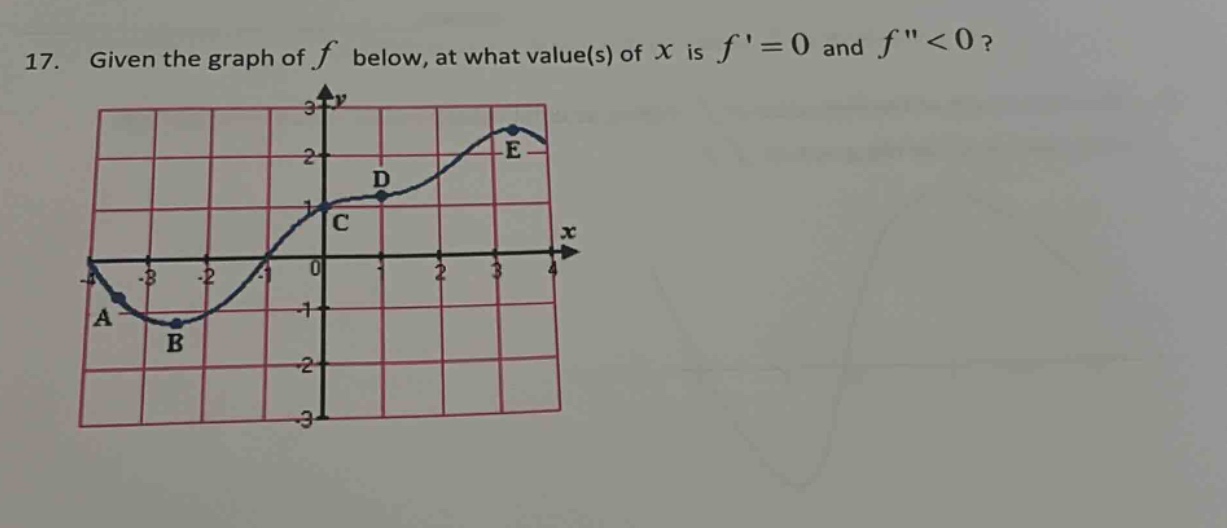
17. given the graph of f below, at what value(s) of x is f = 0 and f < 0?
Answer
Explanation:
Step1: Recall derivative - related concepts
$f'(x) = 0$ at local maxima and minima. The slope of the tangent line to the graph of $y = f(x)$ is zero at these points. $f''(x)<0$ means the function is concave - down.
Step2: Identify points with $f'(x) = 0$
The function $y = f(x)$ has a horizontal tangent (where $f'(x)=0$) at points B and E. At point B, the function has a local minimum, and at point E, the function has a local maximum.
Step3: Determine concavity
A function is concave - down when $f''(x)<0$. The graph of $y = f(x)$ is concave - down at point E. At point B, the graph is concave - up ($f''(x)>0$).
Answer:
$x$ - value corresponding to point E (approximately $x = 3$)