24 which graph below represents a function that is always decreasing over the entire interval -3 < x < 3?
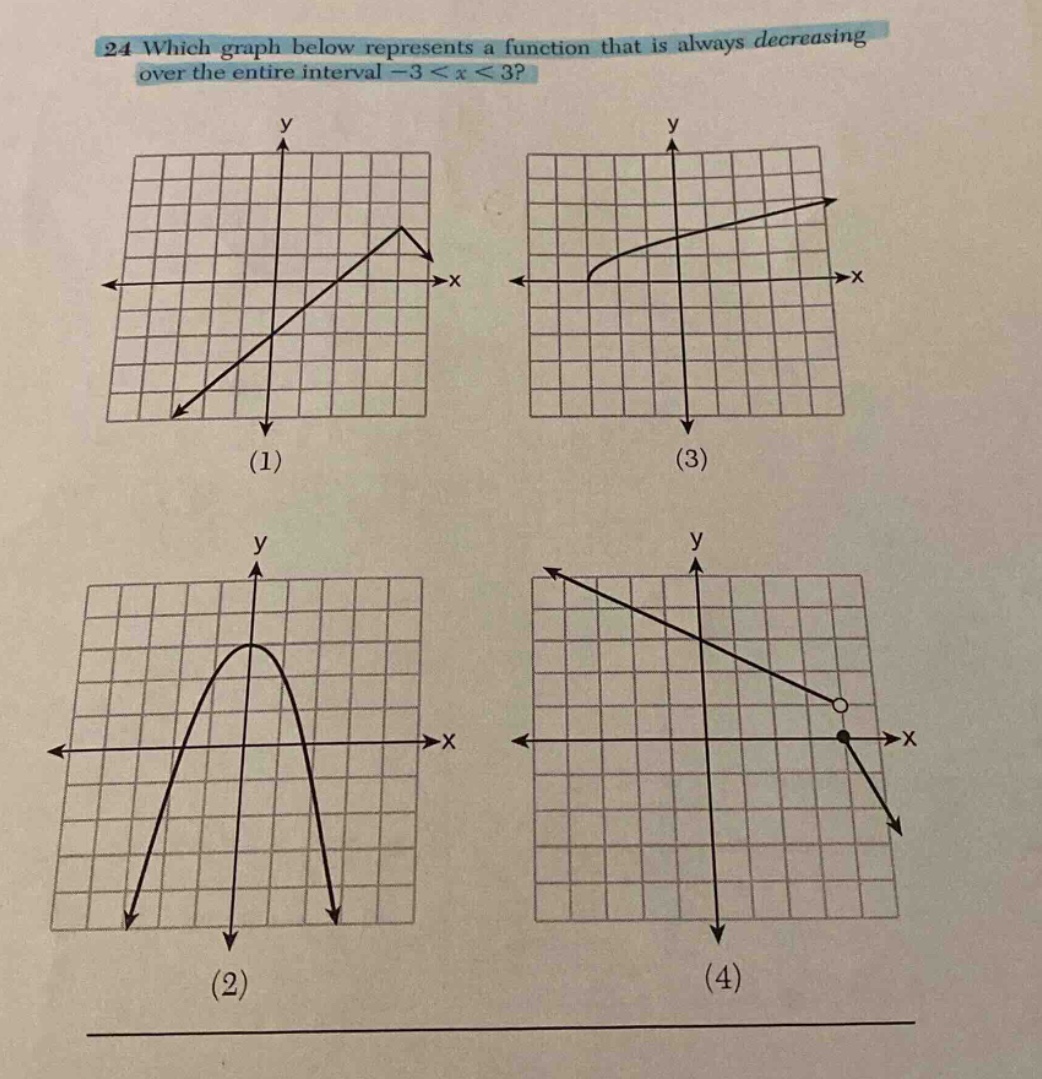
24 which graph below represents a function that is always decreasing over the entire interval -3 < x < 3?
Answer
Explanation:
Step1: Recall decreasing - function property
A function (y = f(x)) is decreasing on an interval if for any (x_1,x_2) in the interval with (x_1<x_2), then (f(x_1)>f(x_2)). Graphically, the function's graph should go down as we move from left - to - right.
Step2: Analyze graph (1)
In graph (1), the function is increasing for part of the interval (- 3<x<3) (the left - hand side of the graph before the peak).
Step3: Analyze graph (2)
In graph (2), the function first increases and then decreases within the interval (-3 < x < 3).
Step4: Analyze graph (3)
In graph (3), the function is increasing over the interval (-3 < x < 3).
Step5: Analyze graph (4)
In graph (4), as (x) increases from (-3) to (3) (moving from left to right), the (y) - values of the function are always decreasing.
Answer:
(4)