25. the profit, in thousands of dollars, from the sale of x kilograms of tuna fish can be modelled by the…
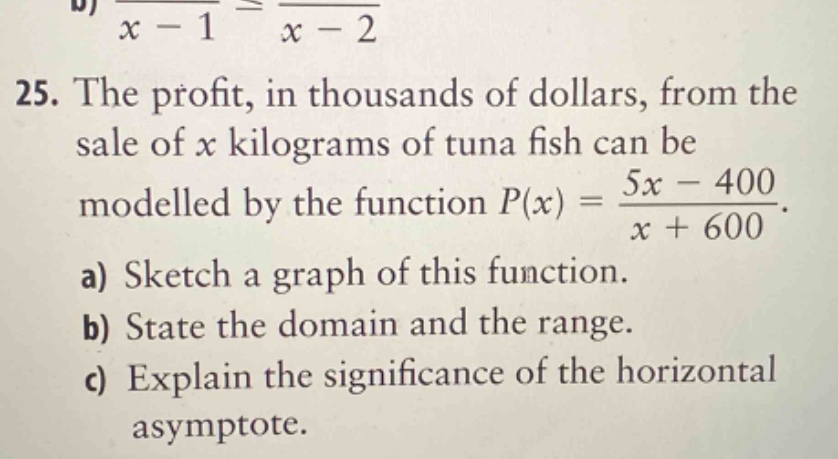
25. the profit, in thousands of dollars, from the sale of x kilograms of tuna fish can be modelled by the function p(x) = (5x - 400)/(x + 600). a) sketch a graph of this function. b) state the domain and the range. c) explain the significance of the horizontal asymptote.
Answer
Explanation:
Step1: Analyze the function for graph - sketching
The function $P(x)=\frac{5x - 400}{x + 600}$ is a rational function. First, find the vertical asymptote by setting the denominator equal to zero: $x+600 = 0$, so $x=-600$. To find the horizontal asymptote, since the degree of the numerator and denominator are the same (both degree 1), the horizontal asymptote is $y=\frac{5}{1}=5$ (the ratio of the leading - coefficients). To find the $x$ - intercept, set $P(x)=0$, so $5x-400 = 0$, which gives $x = 80$. To find the $y$ - intercept, set $x = 0$, so $P(0)=\frac{-400}{600}=-\frac{2}{3}$.
Step2: Determine the domain
The domain of a rational function is all real numbers except the value that makes the denominator zero. Since $x+600\neq0$, the domain is ${x\in R|x\neq - 600}$.
Step3: Determine the range
The range of a rational function of the form $y=\frac{ax + b}{cx + d}$ with $c\neq0$ is all real numbers except the horizontal asymptote value. So the range is ${y\in R|y\neq5}$.
Step4: Explain the horizontal asymptote
The horizontal asymptote $y = 5$ means that as the number of kilograms of tuna fish sold ($x$) gets very large (either positively or negatively), the profit (in thousands of dollars) approaches 5 thousand dollars. In a real - world context, as more and more tuna fish is sold, the profit per kilogram sold approaches a limiting value of 5 thousand dollars per kilogram.
a) To sketch the graph: - Plot the $x$ - intercept at $(80,0)$, the $y$ - intercept at $(0,-\frac{2}{3})$. - Draw a vertical asymptote at $x=-600$ and a horizontal asymptote at $y = 5$. - The graph will have two branches, one in the region $x\lt - 600$ and one in the region $x\gt - 600$. b) Domain: ${x\in R|x\neq - 600}$; Range: ${y\in R|y\neq5}$ c) The horizontal asymptote $y = 5$ represents the limiting value of the profit (in thousands of dollars) as the amount of tuna fish sold ($x$) becomes extremely large.
Answer:
a) Sketch the graph with $x$ - intercept at $(80,0)$, $y$ - intercept at $(0,-\frac{2}{3})$, vertical asymptote $x=-600$ and horizontal asymptote $y = 5$. b) Domain: ${x\in R|x\neq - 600}$, Range: ${y\in R|y\neq5}$ c) It represents the limiting value of the profit as the amount of tuna fish sold becomes extremely large.