30. the graph of $f(x)=\tan x$ has been drawn below. on the same set of axes draw the graph of $g(x)=\tan(x…
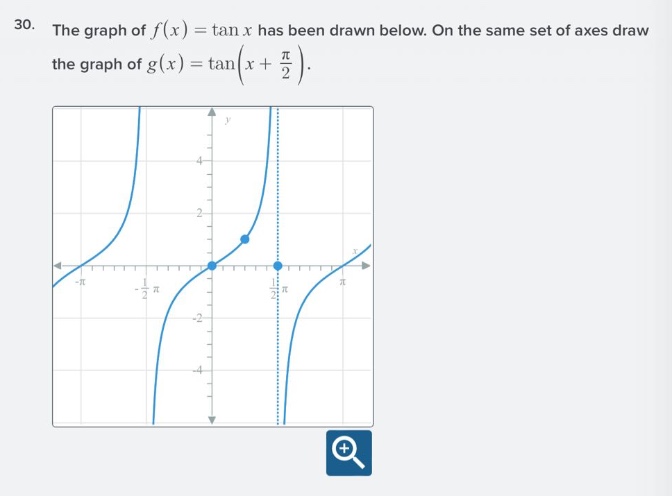
30. the graph of $f(x)=\tan x$ has been drawn below. on the same set of axes draw the graph of $g(x)=\tan(x + \frac{pi}{2})$.
Answer
Explanation:
Step1: Recall transformation rule
The function $g(x)=\tan(x + \frac{\pi}{2})$ is a horizontal - shift of the function $y = \tan(x)$. The general form of a horizontal shift for a function $y = f(x)$ to $y=f(x + c)$ is a shift of $|c|$ units. If $c>0$, the shift is to the left; if $c < 0$, the shift is to the right. Here $c=\frac{\pi}{2}$, so the graph of $y = \tan(x)$ is shifted $\frac{\pi}{2}$ units to the left.
Step2: Identify key - points
For the function $y = \tan(x)$, the vertical asymptotes are at $x=(n+\frac{1}{2})\pi$, $n\in\mathbb{Z}$, and the $x$ - intercepts are at $x = n\pi$, $n\in\mathbb{Z}$. For the function $g(x)=\tan(x+\frac{\pi}{2})$, the vertical asymptotes will be at $x+\frac{\pi}{2}=(n + \frac{1}{2})\pi$, which simplifies to $x=n\pi$. The $x$ - intercepts will be at $x+\frac{\pi}{2}=n\pi$, which simplifies to $x=(n-\frac{1}{2})\pi$.
Step3: Sketch the graph
Using the new vertical asymptotes and $x$ - intercepts, draw the graph of $y = \tan(x+\frac{\pi}{2})$ with the same shape as the graph of $y=\tan(x)$ (a series of U - shaped curves between vertical asymptotes), but shifted $\frac{\pi}{2}$ units to the left of the graph of $y = \tan(x)$.
Answer:
Sketch the graph of $y = \tan(x+\frac{\pi}{2})$ by shifting the graph of $y=\tan(x)$ $\frac{\pi}{2}$ units to the left, using the new vertical asymptotes at $x = n\pi$ and $x$ - intercepts at $x=(n-\frac{1}{2})\pi$, $n\in\mathbb{Z}$.