analyze the functions graph to determine which statement is true.\nover the interval -2.5, 0.5, the local…
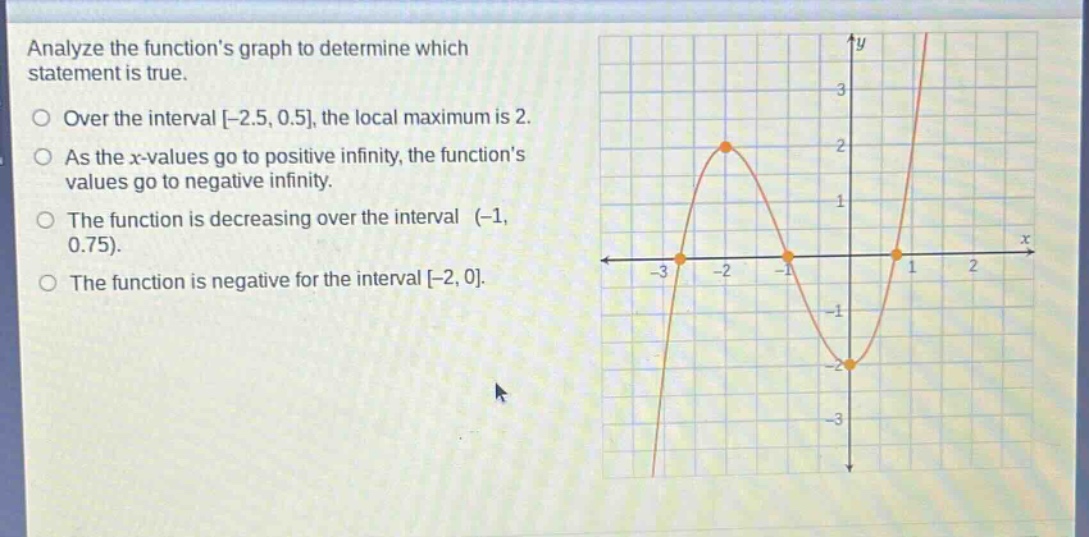
analyze the functions graph to determine which statement is true.\nover the interval -2.5, 0.5, the local maximum is 2.\nas the x - values go to positive infinity, the functions values go to negative infinity.\nthe function is decreasing over the interval (-1, 0.75).\nthe function is negative for the interval -2, 0.
Answer
Answer:
Over the interval [-2.5, 0.5], the local maximum is 2.
Explanation:
Step1: Analyze local - maximum
Observe the graph in [-2.5, 0.5]. The highest y - value is 2.
Step2: Analyze end - behavior
As x goes to positive infinity, the function's values go to positive infinity, not negative infinity.
Step3: Analyze decreasing interval
The function is increasing over (-1, 0.75), not decreasing.
Step4: Analyze sign of function
The function is positive for part of [-2, 0], not negative throughout.