on the axes below, make an appropriate scale and graph exactly one cycle of the trigonometric function y =…
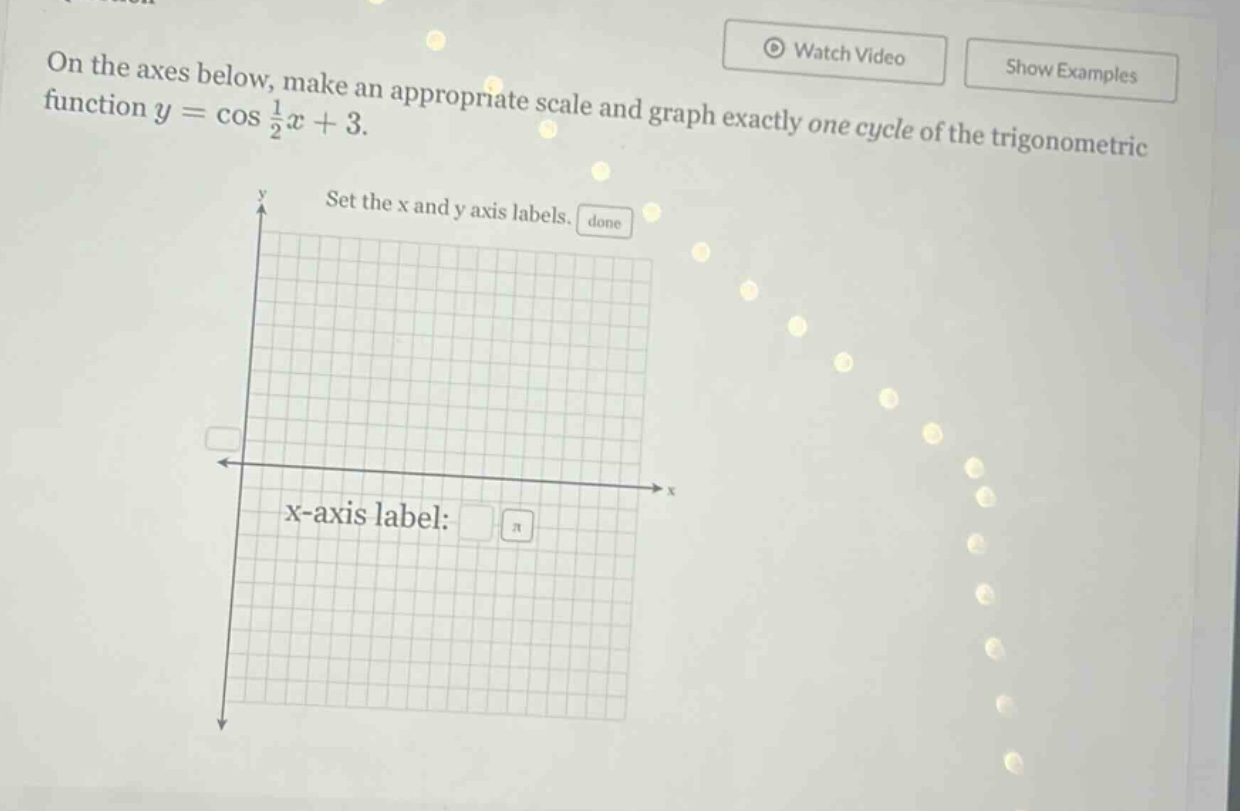
on the axes below, make an appropriate scale and graph exactly one cycle of the trigonometric function y = cos 1/2x + 3. set the x and y axis labels. x - axis label:
Answer
Explanation:
Step1: Identify the period
For the cosine - type function $y = A\cos(Bx - C)+D$, the period $T$ is given by the formula $T=\frac{2\pi}{|B|}$. Here, $B = \frac{1}{2}$, so $T=\frac{2\pi}{\frac{1}{2}}=4\pi$.
Step2: Determine the amplitude and vertical shift
The amplitude $A = 1$ (since the coefficient of $\cos$ is 1) and the vertical shift $D = 3$. The range of $y=\cos(\frac{1}{2}x)$ is $[- 1,1]$, and for $y=\cos(\frac{1}{2}x)+3$, the range is $[2,4]$.
Step3: Find key - points
For one - cycle of $y = \cos(\frac{1}{2}x)+3$, we can find the key - points as follows: When $\frac{1}{2}x = 0$, $x = 0$ and $y=\cos(0)+3=1 + 3=4$. When $\frac{1}{2}x=\frac{\pi}{2}$, $x=\pi$ and $y=\cos(\frac{\pi}{2})+3=0 + 3=3$. When $\frac{1}{2}x=\pi$, $x = 2\pi$ and $y=\cos(\pi)+3=-1 + 3=2$. When $\frac{1}{2}x=\frac{3\pi}{2}$, $x = 3\pi$ and $y=\cos(\frac{3\pi}{2})+3=0 + 3=3$. When $\frac{1}{2}x = 2\pi$, $x = 4\pi$ and $y=\cos(2\pi)+3=1 + 3=4$.
Step4: Set the scale
On the $x$ - axis, we can mark the points $0,\pi,2\pi,3\pi,4\pi$. On the $y$ - axis, we can mark the points $2,3,4$. Then plot the points $(0,4),(\pi,3),(2\pi,2),(3\pi,3),(4\pi,4)$ and connect them with a smooth curve to get one cycle of the function $y=\cos(\frac{1}{2}x)+3$.
To graph the function:
- Label the $x$ - axis with an appropriate scale. Since the period is $4\pi$, we can mark $x = 0,\pi,2\pi,3\pi,4\pi$.
- Label the $y$ - axis. The range of the function is $[2,4]$, so we can mark $y = 2,3,4$.
- Plot the key - points $(0,4),(\pi,3),(2\pi,2),(3\pi,3),(4\pi,4)$.
- Connect the points with a smooth cosine - shaped curve.
The graph of one cycle of the function $y=\cos(\frac{1}{2}x)+3$ is a cosine curve with a period of $4\pi$, an amplitude of 1, and a vertical shift of 3 units up.
(Note: This is a description of how to graph the function. If you were using graph - paper or a graphing utility, you would actually draw the curve on the given axes.)