based on the table, which best predicts the end behavior of the graph of f(x)?\nas x → ∞, f(x) → ∞, and as x…
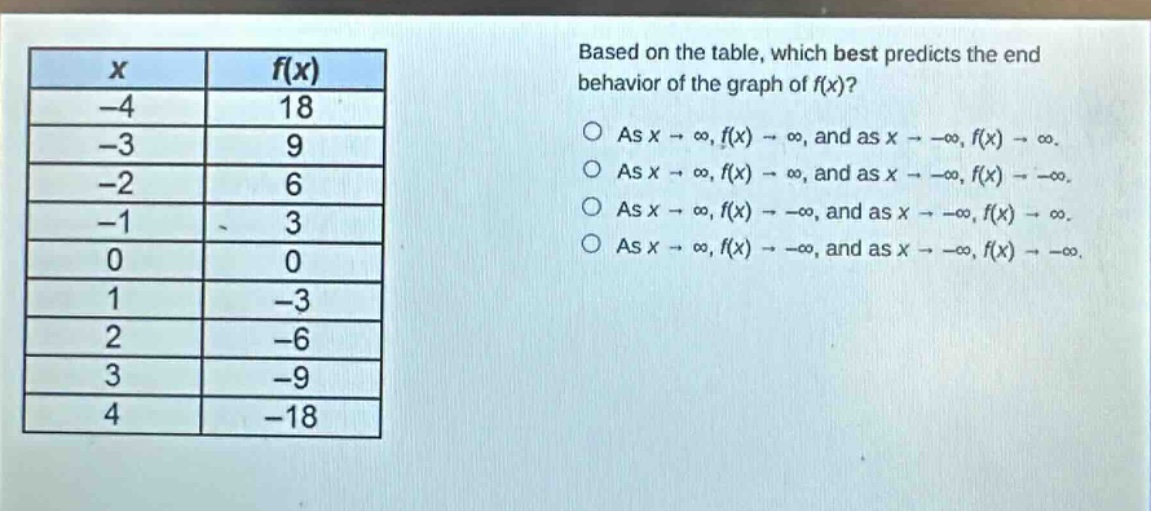
based on the table, which best predicts the end behavior of the graph of f(x)?\nas x → ∞, f(x) → ∞, and as x → -∞, f(x) → ∞.\nas x → ∞, f(x) → ∞, and as x → -∞, f(x) → -∞.\nas x → ∞, f(x) → -∞, and as x → -∞, f(x) → ∞.\nas x → ∞, f(x) → -∞, and as x → -∞, f(x) → -∞.\n\nx\tf(x)\n-4\t18\n-3\t9\n-2\t6\n-1\t3\n0\t0\n1\t-3\n2\t-6\n3\t-9\n4\t-18
Answer
Explanation:
Step1: Analyze positive - x values
As (x) increases from (1) to (4), (f(x)) decreases from (- 3) to (-18). So as (x\rightarrow\infty), (f(x)\rightarrow-\infty).
Step2: Analyze negative - x values
As (x) decreases from (-1) to (-4), (f(x)) increases from (3) to (18). So as (x\rightarrow-\infty), (f(x)\rightarrow\infty).
Answer:
As (x\rightarrow\infty), (f(x)\rightarrow-\infty), and as (x\rightarrow-\infty), (f(x)\rightarrow\infty).