begin with the graph of y = ln x and use transformations to sketch the graph of the given function. f(x)=…
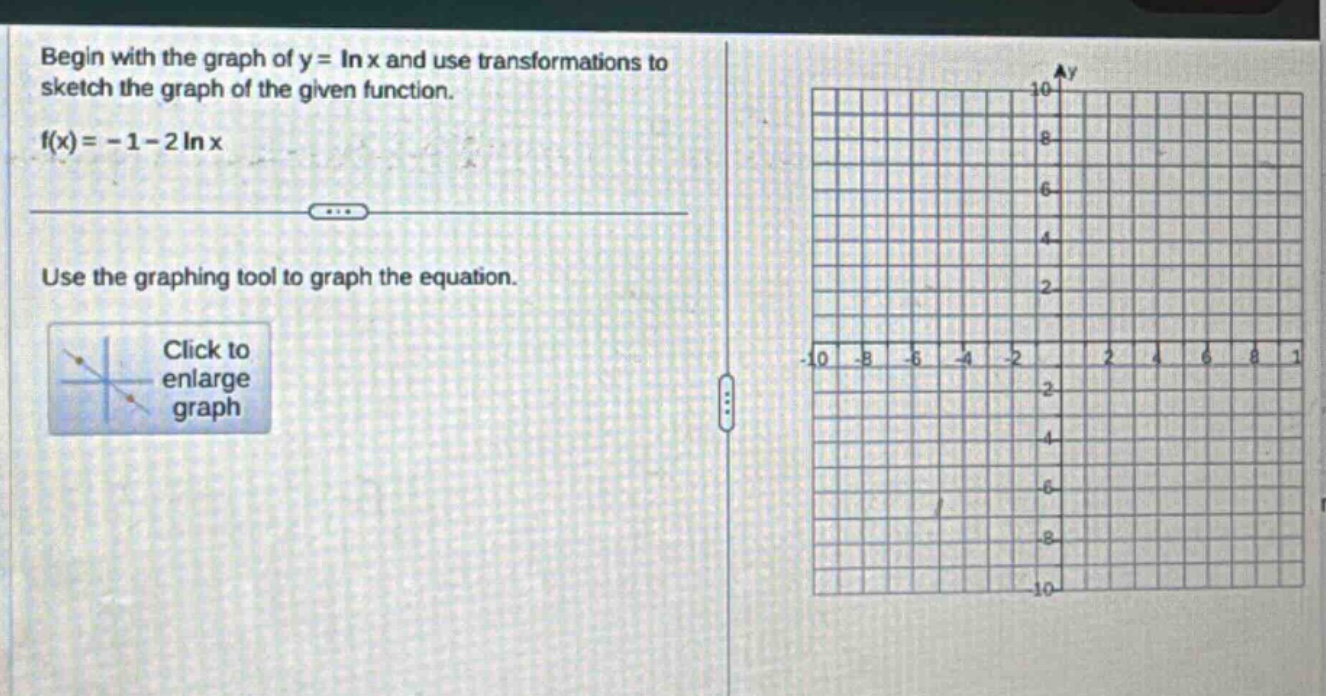
begin with the graph of y = ln x and use transformations to sketch the graph of the given function. f(x)= - 1 - 2 ln x use the graphing tool to graph the equation. click to enlarge graph
Answer
Explanation:
Step1: Analyze vertical - stretch
The coefficient of $\ln x$ is $- 2$. A coefficient $a$ in $y = a\ln x$ causes a vertical stretch by a factor of $|a|$. Here, $|a| = 2$, and the negative sign reflects the graph of $y=\ln x$ about the $x$ - axis. So, starting from $y = \ln x$, the transformation $y=-2\ln x$ first reflects $y = \ln x$ about the $x$ - axis and then vertically stretches it by a factor of 2.
Step2: Analyze vertical - shift
The function is $f(x)=-1 - 2\ln x$. The addition of a constant $k=-1$ in $y=-2\ln x + k$ shifts the graph of $y=-2\ln x$ downward by 1 unit.
To graph the function $y = \ln x$, we know that it has a vertical asymptote at $x = 0$, passes through the point $(1,0)$ since $\ln(1)=0$. For $y=-2\ln x$, the point $(1,0)$ remains $(1,0)$ after reflection and vertical - stretch. For $y=-1 - 2\ln x$, the point $(1,0)$ on $y=-2\ln x$ is shifted to the point $(1,-1)$.
We can use a graphing utility to plot more points and draw the graph of $y=-1 - 2\ln x$ with a vertical asymptote at $x = 0$.
Answer:
Graph the function $y=-1 - 2\ln x$ by first reflecting and vertically stretching the graph of $y = \ln x$ and then shifting it downward. The graph has a vertical asymptote at $x = 0$ and passes through the point $(1,-1)$.