the black graph is y = sin x. choose the equation for the red graph.\ny = sin(x) - 1\ny = sin(x + π)\ny =…
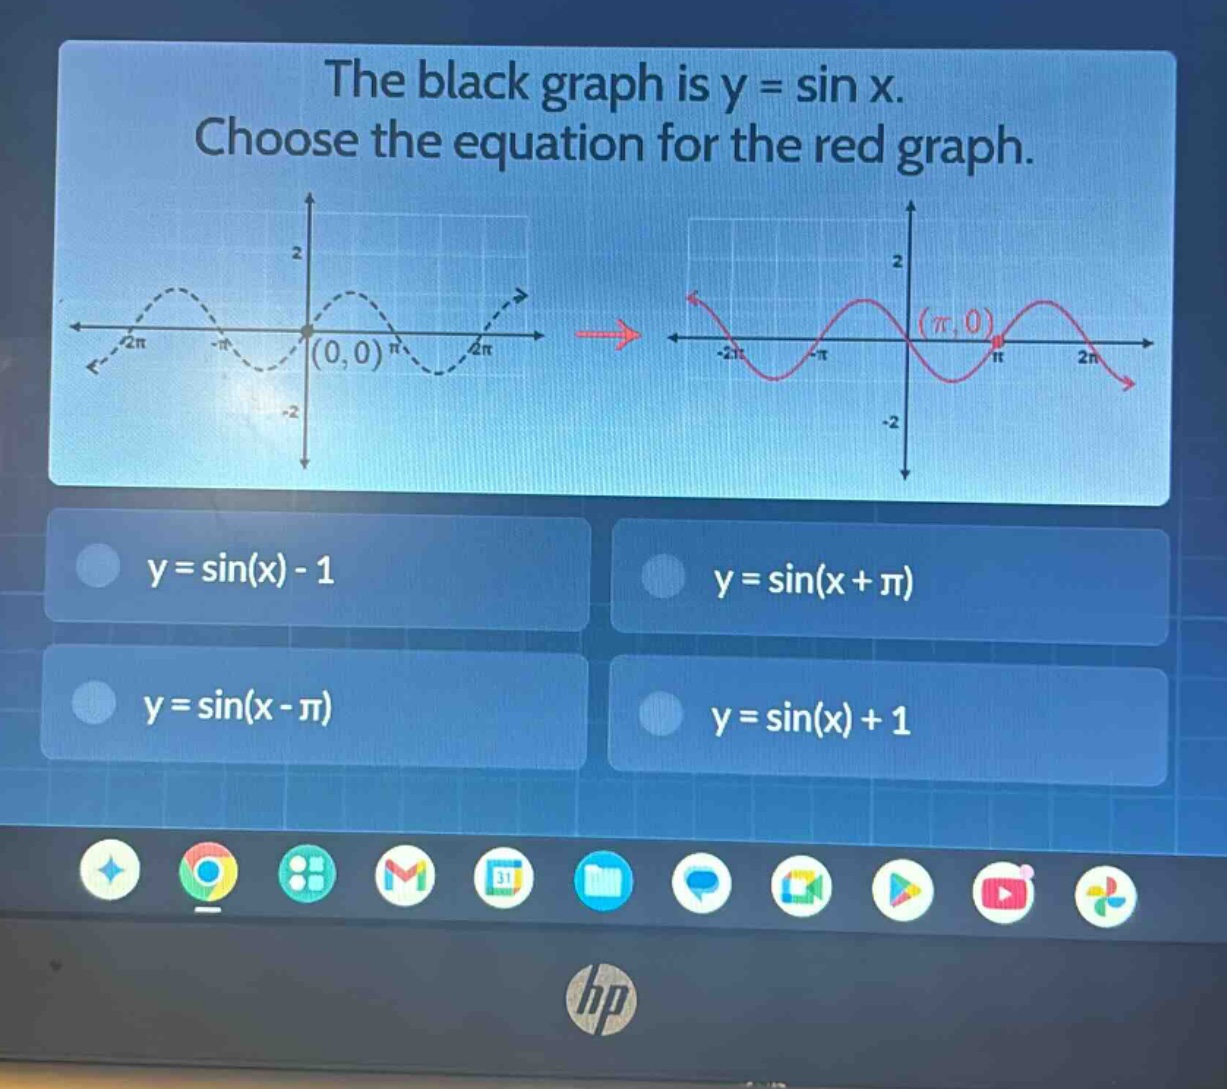
the black graph is y = sin x. choose the equation for the red graph.\ny = sin(x) - 1\ny = sin(x + π)\ny = sin(x - π)\ny = sin(x) + 1
Answer
Explanation:
Step1: Identify the base function and transformation.
The black graph is the base function $y = \sin(x)$. The red graph is a transformation of the black graph. Both graphs have the same amplitude and period. The red graph appears to be a horizontal shift of the black graph.
Step2: Determine the horizontal shift.
The black graph $y = \sin(x)$ passes through the origin $(0, 0)$ with a positive slope. The corresponding point on the red graph, where it crosses the x-axis with a positive slope, is $(\pi, 0)$. This indicates a horizontal shift of $\pi$ units to the right.
Step3: Write the equation for the shifted graph.
A horizontal shift of $h$ units to the right transforms a function $f(x)$ into $f(x-h)$. For the base function $y = \sin(x)$ and a shift of $\pi$ units to the right ($h=\pi$), the transformed equation is $y = \sin(x - \pi)$.
Step4: Verify the equation.
We can check a point. For example, at $x = \frac{3\pi}{2}$, the red graph has a value of $y=1$. Using the equation $y = \sin(x - \pi)$: $y = \sin(\frac{3\pi}{2} - \pi) = \sin(\frac{\pi}{2}) = 1$. This matches the graph.
Answer:
$y = \sin(x - \pi)$