the black graph is y = sin x. choose the equation for the red graph. y = sin(x - π/2) y + 2 = sin x y =…
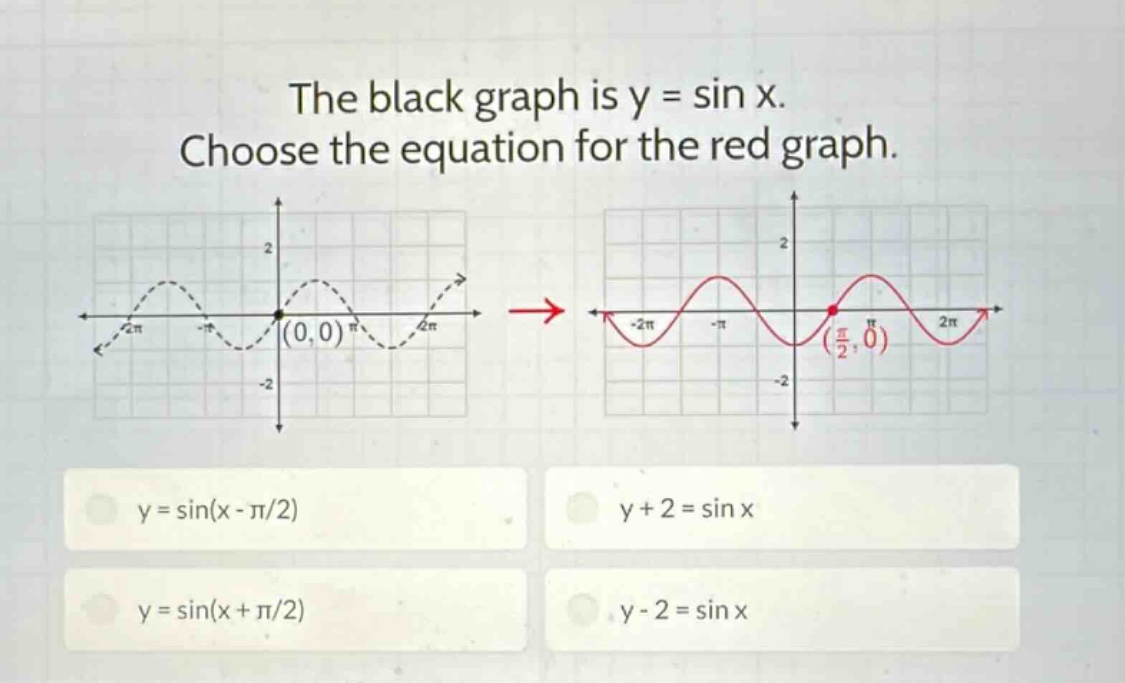
the black graph is y = sin x. choose the equation for the red graph. y = sin(x - π/2) y + 2 = sin x y = sin(x + π/2) y - 2 = sin x
Answer
Explanation:
Step1: Recall sine - function transformation rules
The general form of a sine - function transformation is $y = A\sin(B(x - C))+D$, where $C$ represents a horizontal shift. A shift of the graph of $y = \sin x$ to the right by $h$ units gives $y=\sin(x - h)$ and a shift to the left by $h$ units gives $y=\sin(x + h)$.
Step2: Analyze the shift from $y = \sin x$ to the red graph
The graph of $y = \sin x$ has a zero - point at $(0,0)$. The red graph has a zero - point at $(\frac{\pi}{2},0)$, which means the graph of $y=\sin x$ is shifted to the right by $\frac{\pi}{2}$ units. According to the horizontal - shift rule for the sine function, if $y = \sin x$ is shifted to the right by $\frac{\pi}{2}$ units, the equation of the new graph is $y=\sin(x-\frac{\pi}{2})$.
Answer:
$y = \sin(x-\frac{\pi}{2})$