a cake is taken out of an oven. its temperature (in °c) after t minutes can be modeled with an exponential…
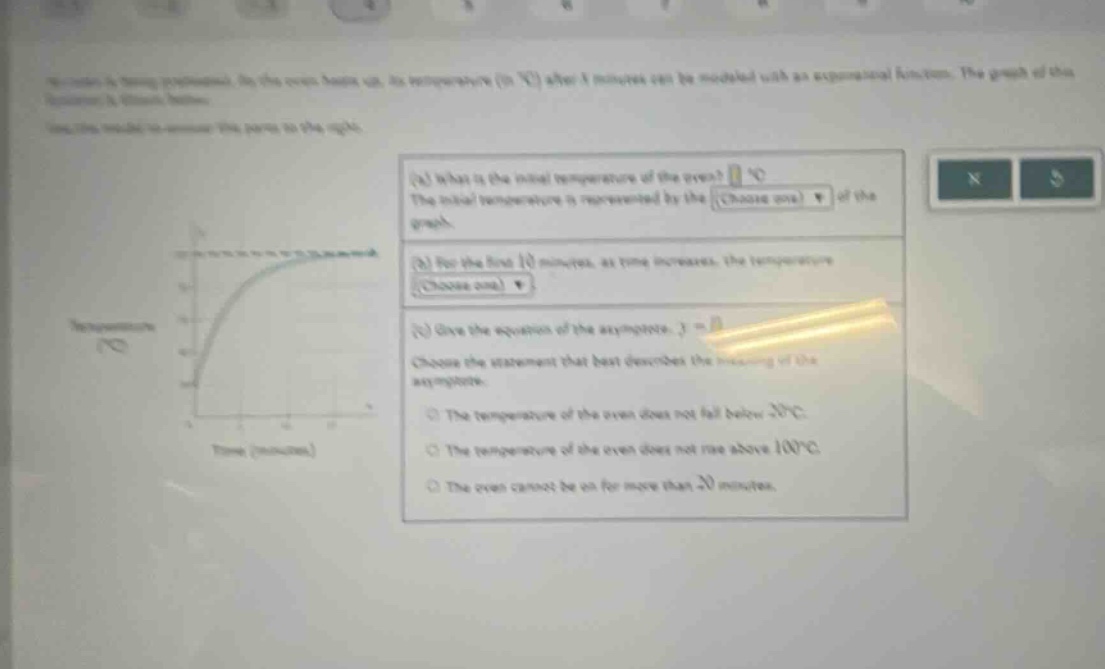
a cake is taken out of an oven. its temperature (in °c) after t minutes can be modeled with an exponential - function. the graph of this function is shown below. (a) what is the initial temperature of the oven? °c the initial temperature is represented by the (choose one) of the graph. (b) for the first 10 minutes, as time increases, the temperature (choose one) (c) give the equation of the asymptote. y = choose the statement that best describes the meaning of the asymptote. the temperature of the oven does not fall below 20°c the temperature of the oven does not rise above 100°c the oven cannot be on for more than 20 minutes.
Answer
Explanation:
Step1: Find initial temperature
The initial temperature is the temperature at time (t = 0). On the graph of the exponential - function representing the temperature of the roast over time, the initial temperature is the (y) - intercept of the graph.
Step2: Analyze temperature change in first 10 minutes
For an exponential growth - like function (as the temperature of the roast is increasing over time), as time increases in the first 10 minutes, the temperature increases.
Step3: Determine the asymptote
An asymptote of a temperature - time graph for a heating or cooling process represents a limiting value of the temperature. If the asymptote is (y = 20), it means the temperature of the roast will approach but not fall below (20^{\circ}C).
Answer:
(a) The initial temperature of the roast is represented by the (y) - intercept of the graph. (b) For the first 10 minutes, as time increases, the temperature increases. (c) If the equation of the asymptote is (y = 20), the statement that best describes the meaning of the asymptote is: The temperature of the oven does not fall below (20^{\circ}C).