when camilla woke up, she discovered that it had snowed several inches overnight. she went outside and built…
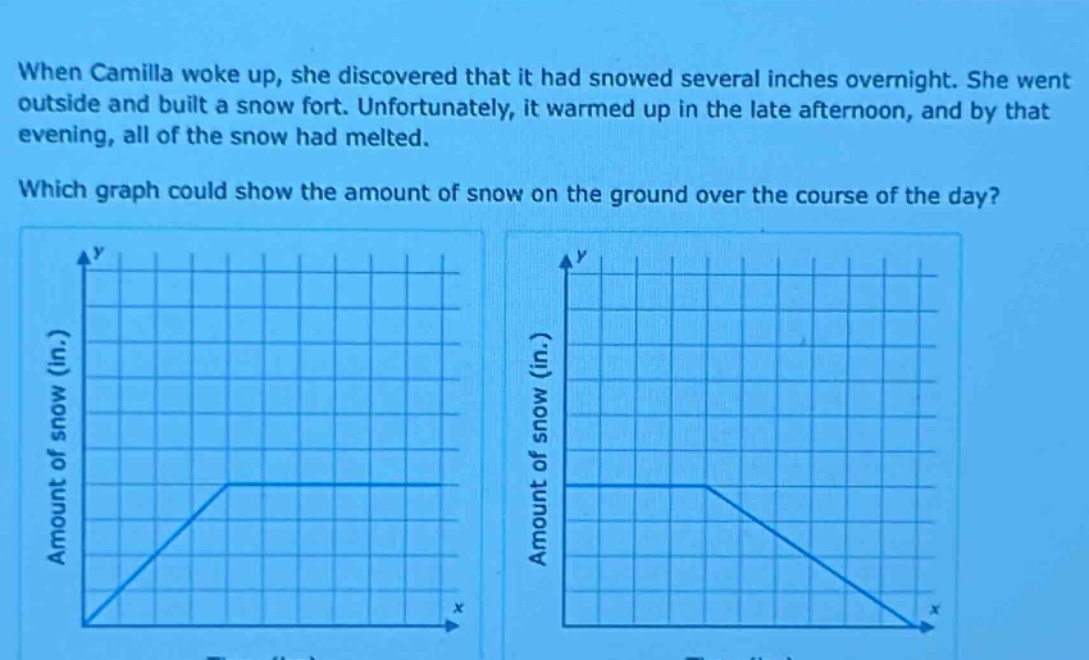
when camilla woke up, she discovered that it had snowed several inches overnight. she went outside and built a snow fort. unfortunately, it warmed up in the late afternoon, and by that evening, all of the snow had melted. which graph could show the amount of snow on the ground over the course of the day?
Answer
Explanation:
Step1: Analyze the first graph
The first graph shows the amount of snow starting from (0) and increasing to a certain value and then remaining constant. But according to the problem, when Camilla woke up, there was already snow (it had snowed overnight), so the initial amount of snow should not be (0).
Step2: Analyze the second graph
The second graph shows that at the start (when Camilla woke up), there was a non - zero amount of snow (which is correct as it snowed overnight). Then, in the late afternoon, it started to melt (the amount of snow decreased) and by evening (the end of the (x) - axis representation of time), the snow had melted (amount of snow became (0)).
Answer:
The second graph.