changes in period and phase shift of sine and cosine functions\nwhich of the following is the graph of $y =…
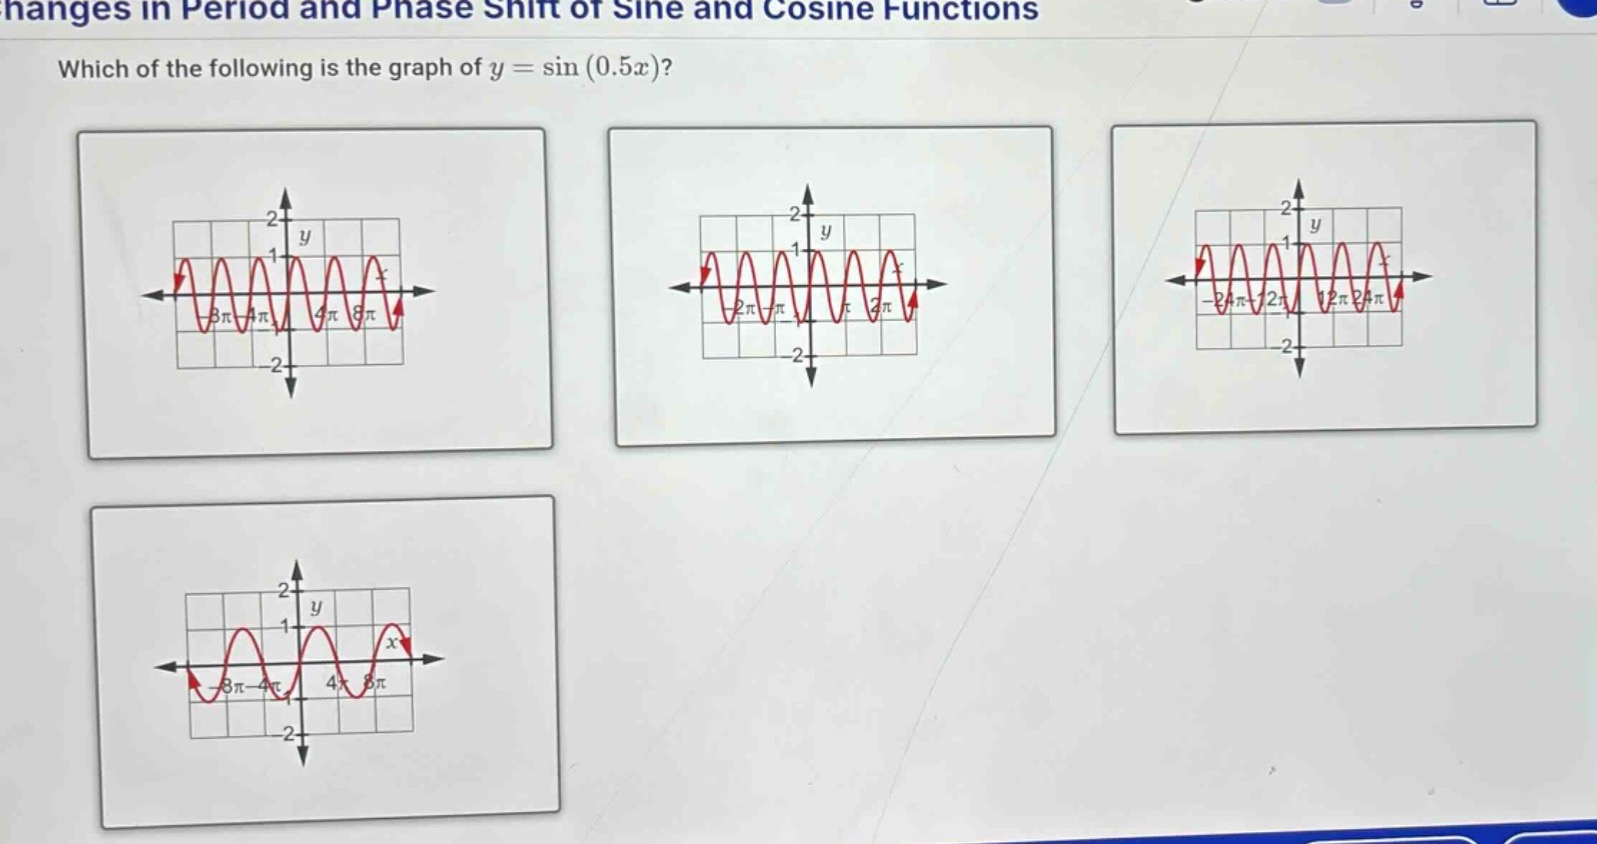
changes in period and phase shift of sine and cosine functions\nwhich of the following is the graph of $y = \\sin(0.5x)$?
Answer
Explanation:
Step1: Recall period formula
The general form of a sine - function is $y = A\sin(Bx - C)+D$, and its period $T=\frac{2\pi}{|B|}$. For the function $y=\sin(0.5x)$, $B = 0.5$.
Step2: Calculate the period
$T=\frac{2\pi}{|0.5|}=\frac{2\pi}{0.5}=4\pi$. The standard sine - function $y = \sin(x)$ has a period of $2\pi$. The function $y=\sin(0.5x)$ has a period of $4\pi$, which means it takes $4\pi$ units along the $x$ - axis to complete one full cycle.
Answer:
The graph with a period of $4\pi$ (usually the one where the sine - wave repeats itself every $4\pi$ units along the $x$ - axis among the given options). Without specific option identifiers, it's not possible to give a letter - based answer, but the correct graph is the one with a period of $4\pi$.