choose the graph of $y = \\log_{3}(x - 1)$
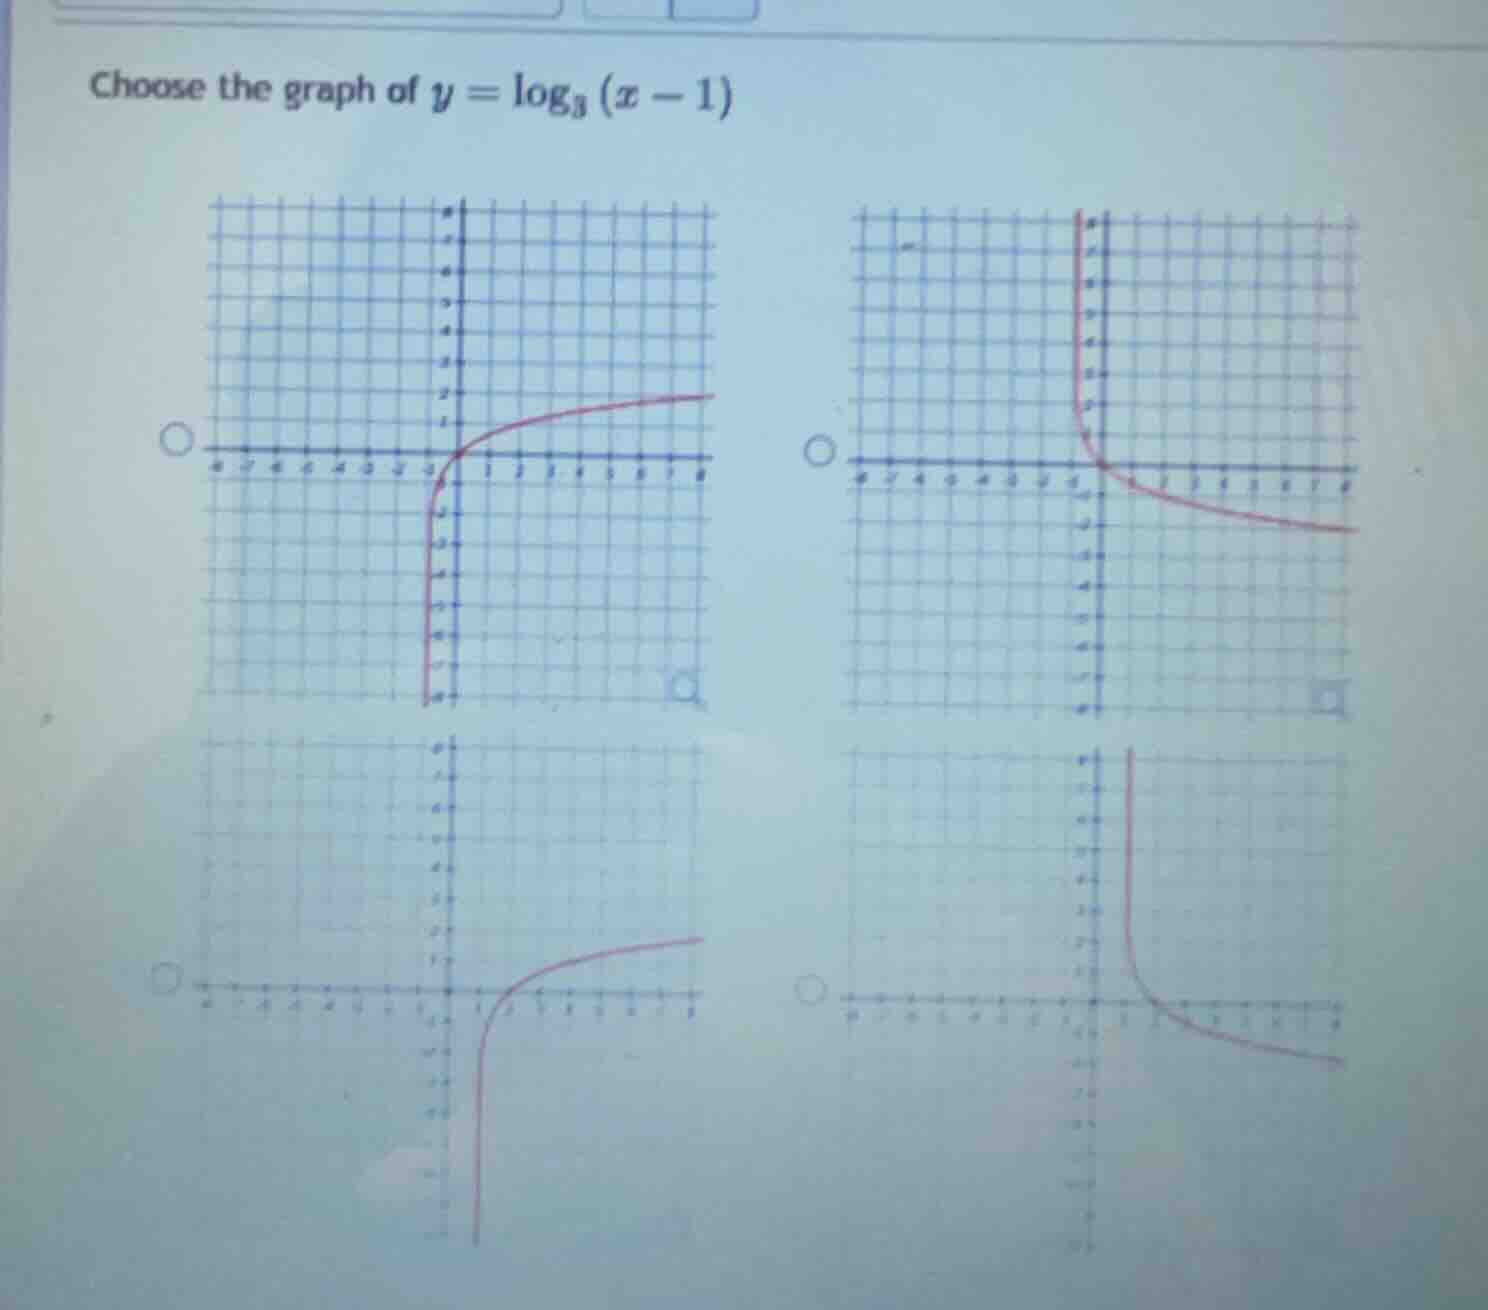
choose the graph of $y = \\log_{3}(x - 1)$
Answer
Explanation:
Step1: Find vertical asymptote
For $y=\log_3(x-1)$, set argument to 0: $x-1=0 \implies x=1$
Step2: Find domain
Logarithm argument > 0: $x-1>0 \implies x>1$
Step3: Find key point
Set $x-1=3^0=1$, so $x=2$, $y=0$. The graph passes through $(2,0)$.
Step4: Analyze function behavior
Since base $3>1$, the function is increasing for $x>1$. As $x\to1^+$, $y\to-\infty$; as $x\to+\infty$, $y\to+\infty$.
Answer:
The correct graph is the top-left one (the increasing curve with vertical asymptote $x=1$, passing through $(2,0)$, defined only for $x>1$).