choose the intervals where the graph has a decreasing average rate of change.\n□ x = 0 to x = 13\n□ x = 3 to…
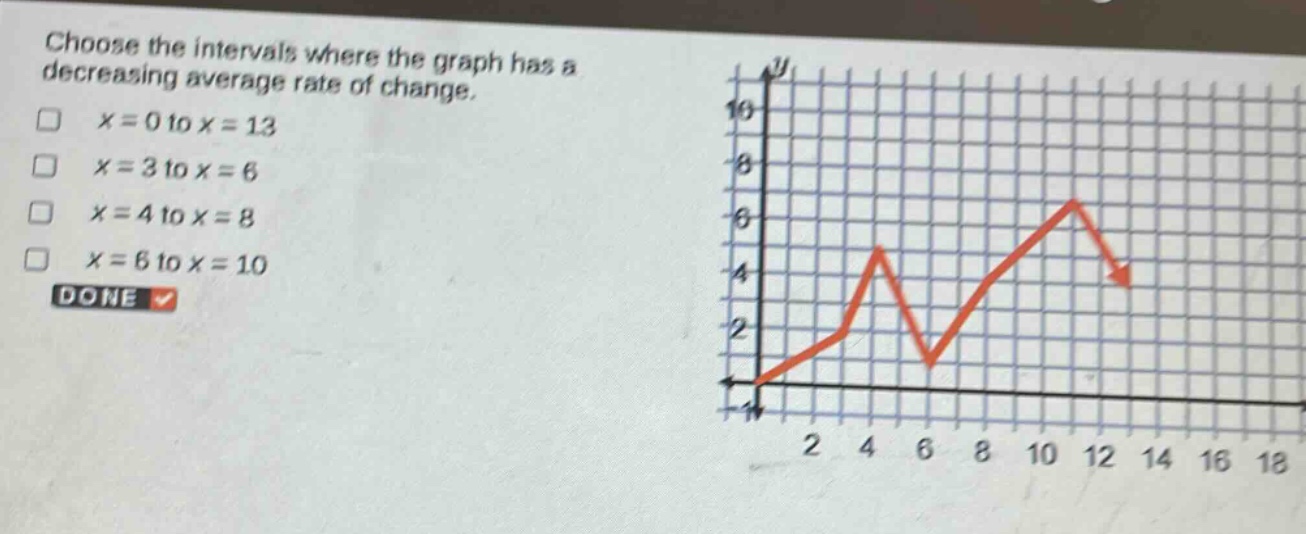
choose the intervals where the graph has a decreasing average rate of change.\n□ x = 0 to x = 13\n□ x = 3 to x = 6\n□ x = 4 to x = 8\n□ x = 6 to x = 10\ndone
Answer
Answer:
- x = 6 to x = 10
Explanation:
Step1: Recall rate - of - change concept
The average rate of change of a function (y = f(x)) over the interval ([a,b]) is (\frac{f(b)-f(a)}{b - a}). A decreasing average rate of change means (f(b)-f(a)<0) (i.e., (f(b)<f(a))) when (b > a).
Step2: Analyze interval (x = 0) to (x = 13)
From the graph, as (x) goes from (0) to (13), the function first increases, then decreases, then increases again. So, the overall average rate of change is not always decreasing.
Step3: Analyze interval (x = 3) to (x = 6)
As (x) goes from (3) to (6), the function value increases. So, the average rate of change (\frac{f(6)-f(3)}{6 - 3}>0) (since (f(6)>f(3))).
Step4: Analyze interval (x = 4) to (x = 8)
The function first increases from (x = 4) to some point and then decreases. The overall average rate of change is not clearly decreasing over the whole interval.
Step5: Analyze interval (x = 6) to (x = 10)
As (x) goes from (6) to (10), the function value decreases. So, (f(10)<f(6)) and the average rate of change (\frac{f(10)-f(6)}{10 - 6}<0), which means it has a decreasing average rate of change.