choosing the graph of the quotient of two functions\nwhich graph shows $h(x)=\\frac{f(x)}{g(x)}$?
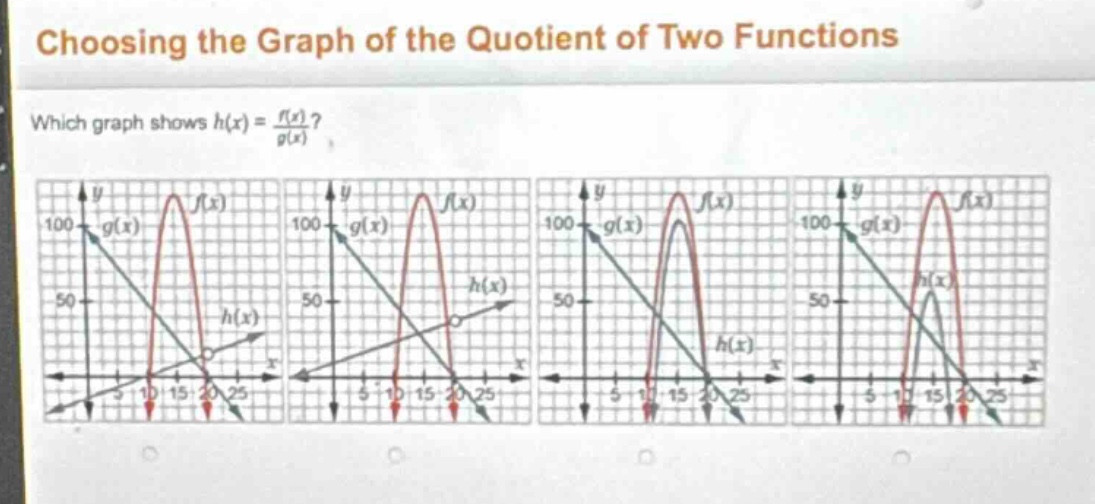
choosing the graph of the quotient of two functions\nwhich graph shows $h(x)=\\frac{f(x)}{g(x)}$?
Answer
Explanation:
Step1: Identify domain of $h(x)$
$h(x)=\frac{f(x)}{g(x)}$ is undefined when $g(x)=0$. For linear $g(x)$ with $y$-intercept 100, solve $g(x)=0$: $g(x)$ crosses $x$-axis at $x=20$, so $h(x)$ has a hole/vertical asymptote at $x=20$, eliminating graphs 3 and 4.
Step2: Analyze sign of $h(x)$
For $x<20$, $f(x)>0$ and $g(x)>0$, so $h(x)=\frac{f(x)}{g(x)}>0$. For $x>20$, $f(x)<0$ and $g(x)<0$, so $h(x)=\frac{f(x)}{g(x)}>0$. This means $h(x)$ is always positive, eliminating graph 1 (which has negative $h(x)$ for $x>20$).
Step3: Verify behavior at $x=10$
At $x=10$, $f(x)$ is positive, $g(x)=50$, so $h(x)=\frac{f(10)}{50}>0$, which matches graph 2.
Answer:
The second graph (top row, second from left) with $h(x)$ positive everywhere, undefined at $x=20$