christopher kicks a football. the graph below shows the height of the football h in meters after t seconds…
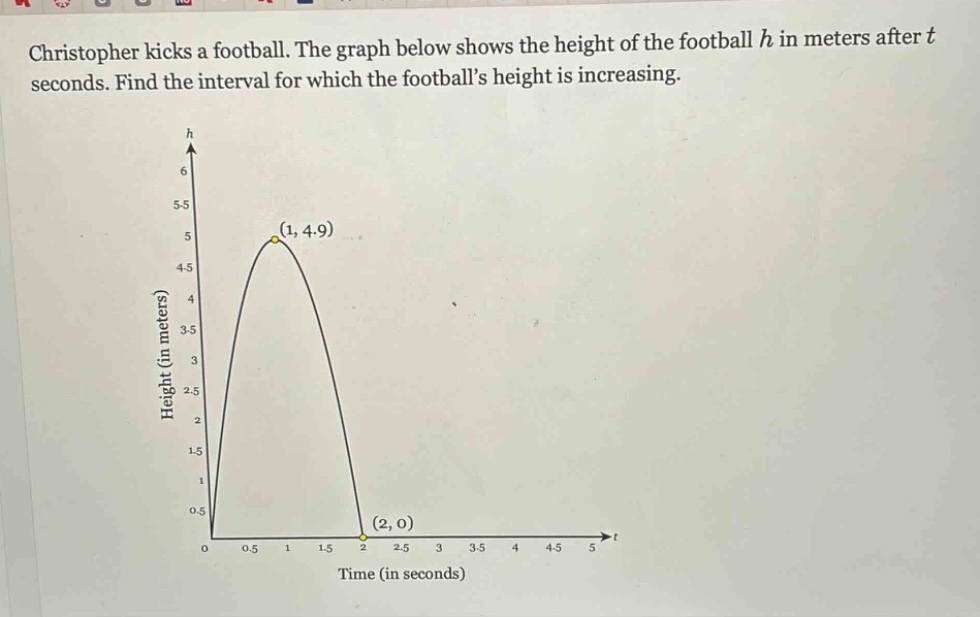
christopher kicks a football. the graph below shows the height of the football h in meters after t seconds. find the interval for which the footballs height is increasing.
Answer
Explanation:
Step1: Identify variables and axes.
The horizontal axis represents time $t$ in seconds, and the vertical axis represents height $h$ in meters.
Step2: Locate the increasing portion of the graph.
The height $h$ is increasing when the graph is rising from left to right. Observe the curve starting from $t=0$.
Step3: Identify the turning point.
The graph rises until it reaches its maximum height at the point $(1, 4.9)$. This occurs at time $t=1$ second.
Step4: Determine the time interval for increasing height.
The height increases from the start time $t=0$ until it reaches the maximum height at $t=1$. Therefore, the interval for which the height is increasing is from $t=0$ to $t=1$.
Answer:
The interval for which the football's height is increasing is $[0, 1]$.