complete the following statements for the cosine function shown in the graph. the minimum value is. the…
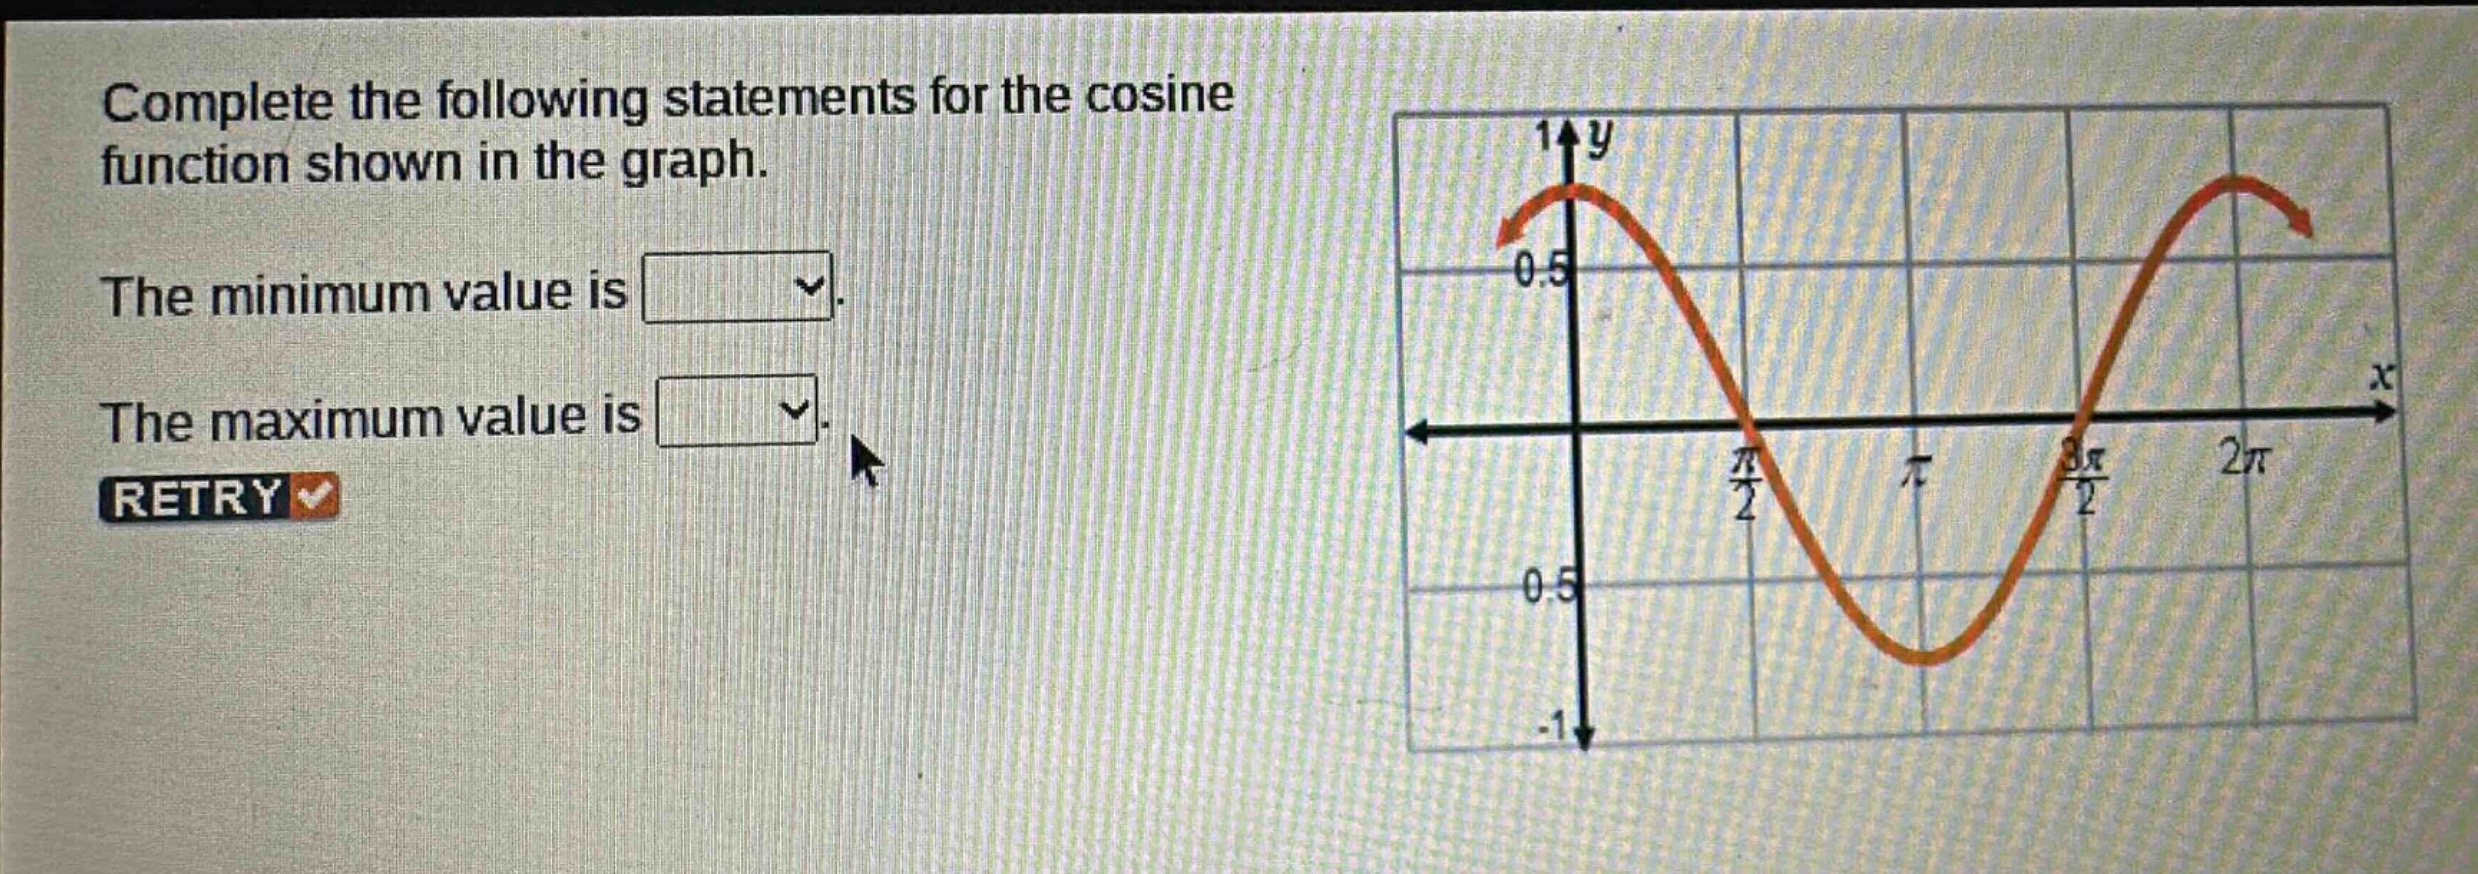
complete the following statements for the cosine function shown in the graph. the minimum value is. the maximum value is. retry
Answer
Explanation:
Step1: Observe the graph
The lowest - point of the cosine - function graph on the y - axis is the minimum value.
Step2: Identify the minimum
From the graph, the minimum value of the cosine function is - 1.
Step3: Identify the maximum
The highest - point of the cosine - function graph on the y - axis is the maximum value. From the graph, the maximum value of the cosine function is 1.
Answer:
The minimum value is - 1. The maximum value is 1.