complete the table and write the equation for the relationship shown in the graph.
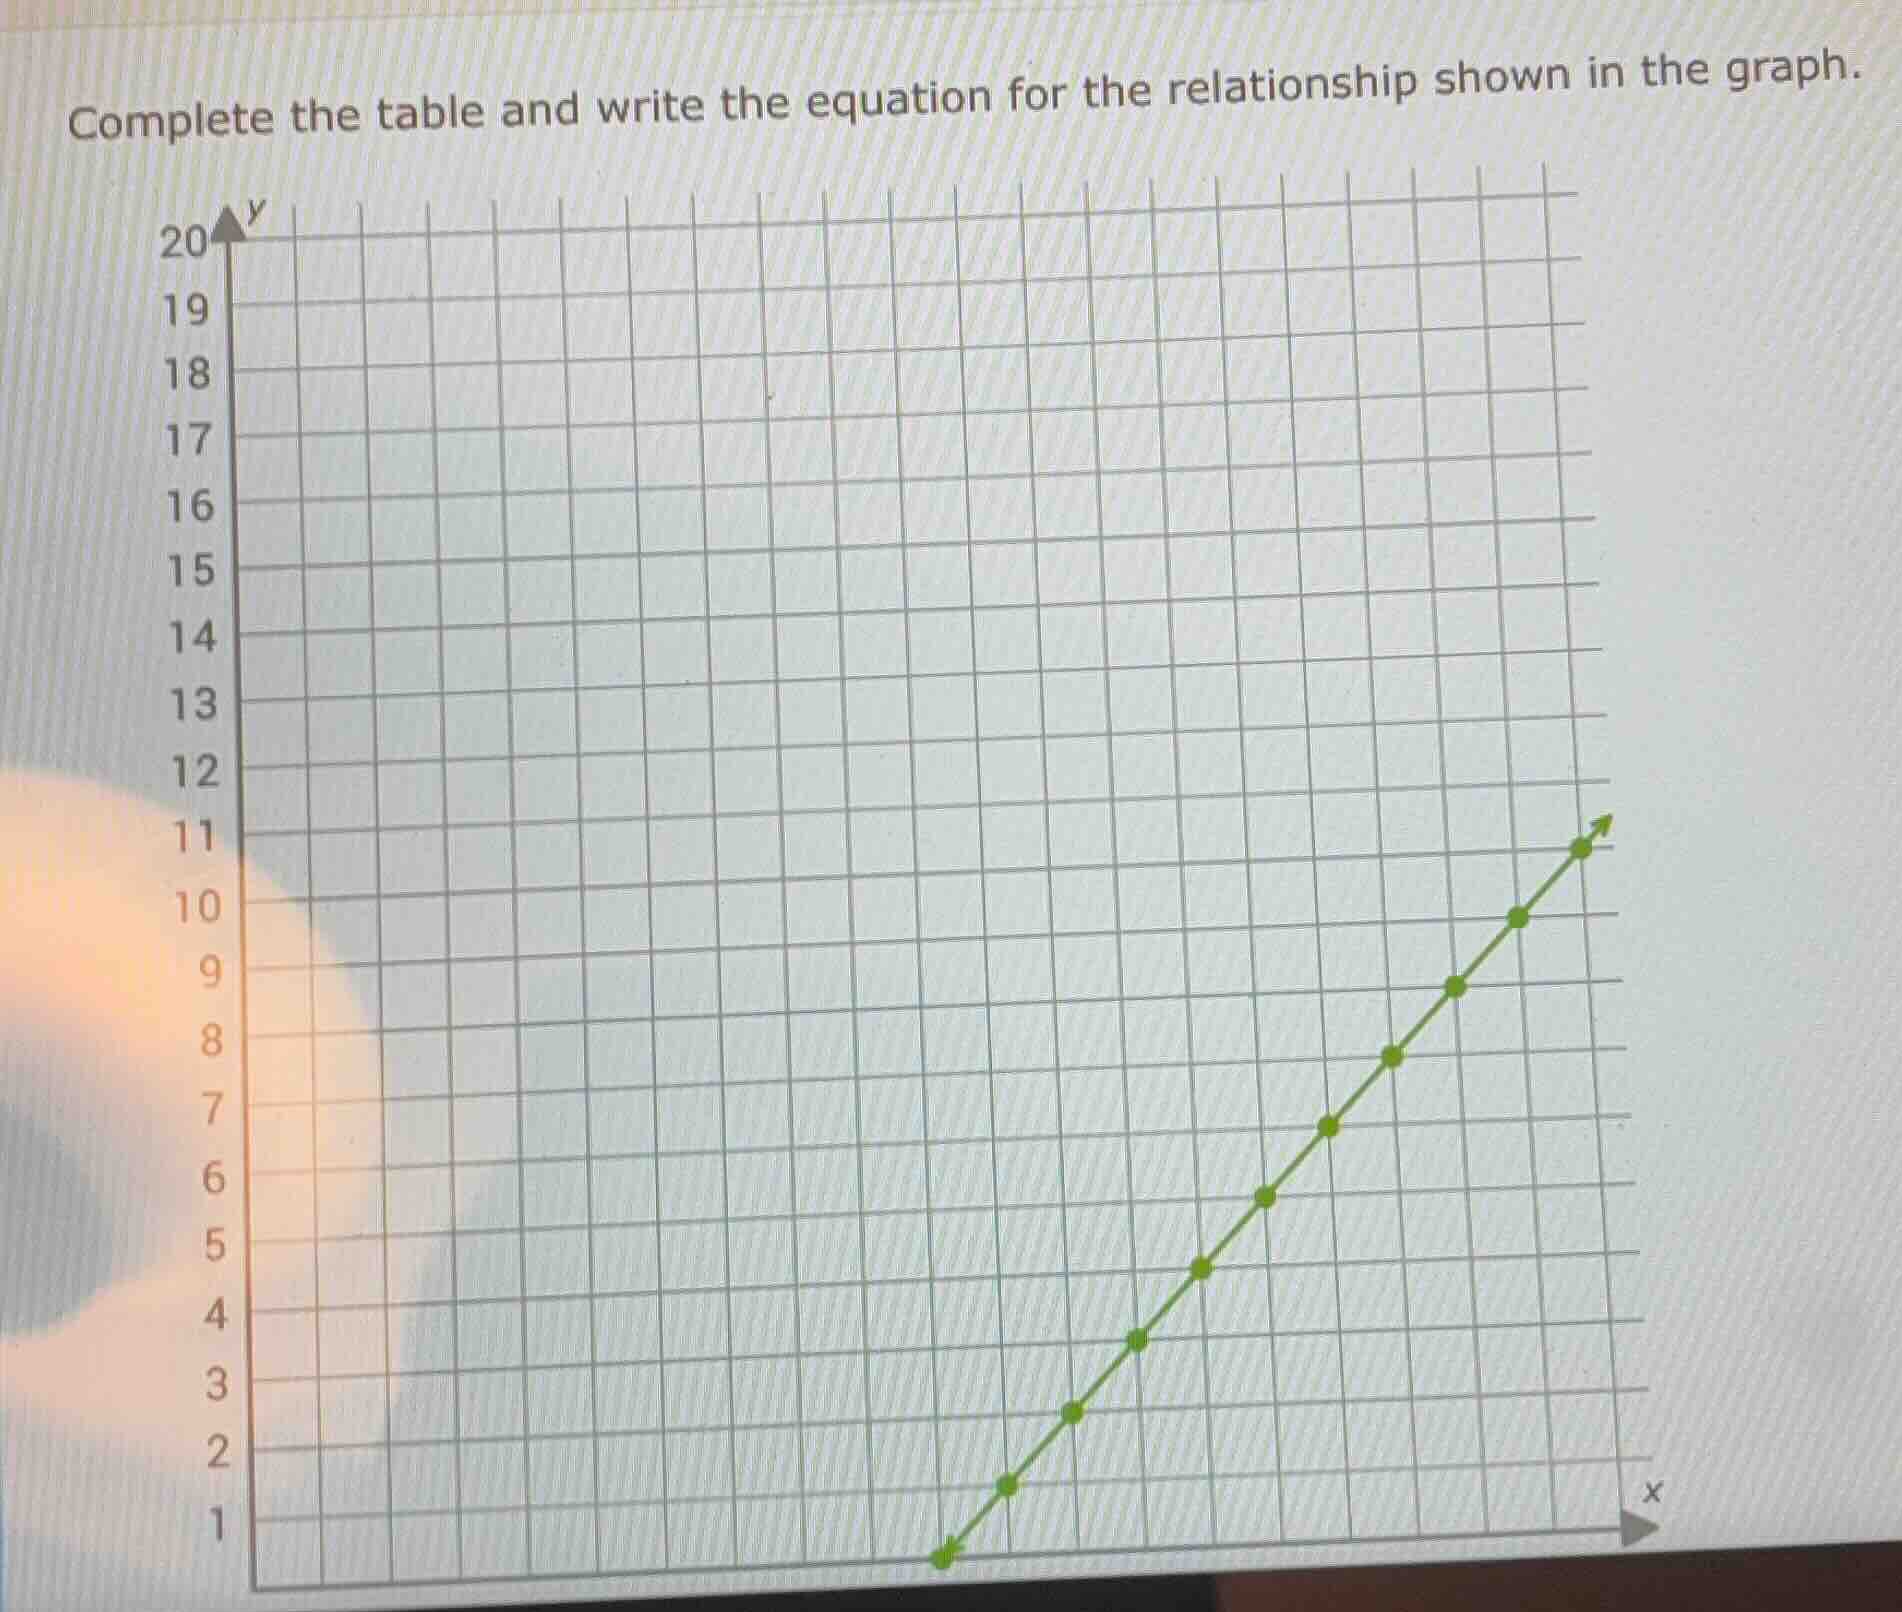
complete the table and write the equation for the relationship shown in the graph.
Answer
Explanation:
Step1: Identify plotted points
The points from the graph are: $(1,0)$, $(2,1)$, $(3,2)$, $(4,3)$, $(5,4)$, $(6,5)$, $(7,6)$, $(8,7)$, $(9,8)$, $(10,9)$, $(11,10)$
Step2: Find slope ($m$)
Use two points, e.g., $(1,0)$ and $(2,1)$: $m = \frac{y_2-y_1}{x_2-x_1} = \frac{1-0}{2-1} = 1$
Step3: Find y-intercept ($b$)
Use $y=mx+b$, substitute $m=1$, $(x,y)=(1,0)$: $0 = 1(1) + b$ $b = 0 - 1 = -1$
Step4: Write linear equation
Substitute $m=1$, $b=-1$ into $y=mx+b$: $y = x - 1$
Step5: Build the table
Map $x$ values to $y=x-1$:
| $x$ | $y$ |
|---|---|
| 1 | 0 |
| 2 | 1 |
| 3 | 2 |
| 4 | 3 |
| 5 | 4 |
| 6 | 5 |
| 7 | 6 |
| 8 | 7 |
| 9 | 8 |
| 10 | 9 |
| 11 | 10 |
Answer:
Completed Table:
| $x$ | $y$ |
|---|---|
| 1 | 0 |
| 2 | 1 |
| 3 | 2 |
| 4 | 3 |
| 5 | 4 |
| 6 | 5 |
| 7 | 6 |
| 8 | 7 |
| 9 | 8 |
| 10 | 9 |
| 11 | 10 |
Equation:
$y = x - 1$