consider the function $f(x)$ shown in the graph below.\n(note that you can click on the graph to get a…
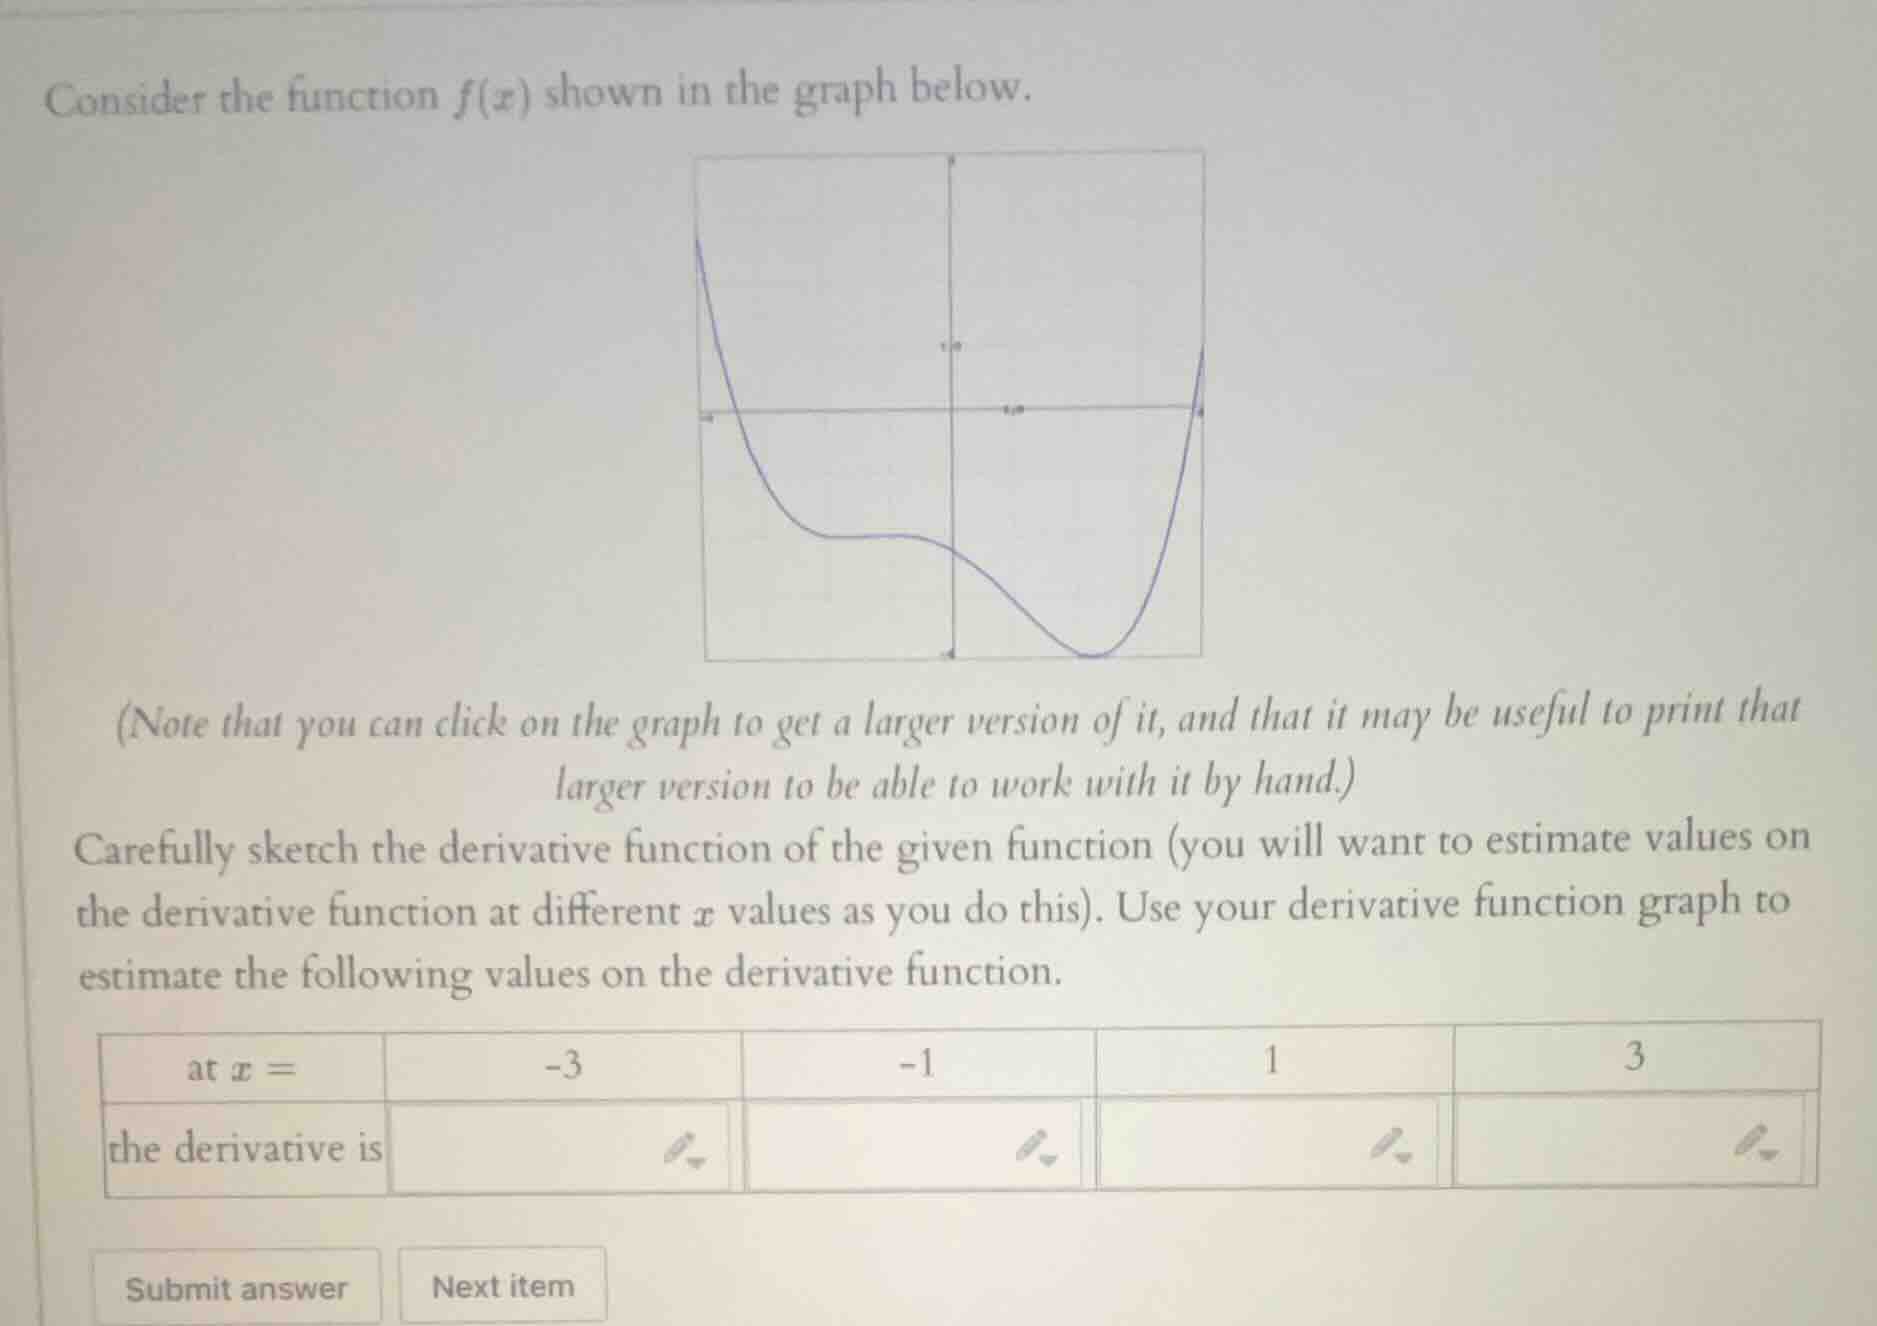
consider the function $f(x)$ shown in the graph below.\n(note that you can click on the graph to get a larger version of it, and that it may be useful to print that larger version to be able to work with it by hand.)\ncarefully sketch the derivative function of the given function (you will want to estimate values on the derivative function at different $x$ values as you do this). use your derivative function graph to estimate the following values on the derivative function.\n| at $x =$ | -3 | -1 | 1 | 3 |\n| ---- | ---- | ---- | ---- | ---- |\n| the derivative is | | | | |
Answer
Explanation:
Step1: Analyze slope at x=-3
The graph of $f(x)$ at $x=-3$ is a steep downward-sloping line. Estimate the slope: for a run of 1, the drop is ~6, so slope $\approx -6$.
Step2: Analyze slope at x=-1
At $x=-1$, $f(x)$ is nearly flat (local minimum region). Slope $\approx 0$.
Step3: Analyze slope at x=1
At $x=1$, $f(x)$ is at its lowest point, horizontal. Slope $\approx 0$.
Step4: Analyze slope at x=3
At $x=3$, $f(x)$ is steep upward-sloping. For a run of 1, the rise is ~6, so slope $\approx 6$.
Answer:
| at $x=$ | -3 | -1 | 1 | 3 |
|---|---|---|---|---|
| the derivative is | $-6$ | $0$ | $0$ | $6$ |