over the course of a full year, the daylight in a certain city follows a periodic pattern. the graph below…
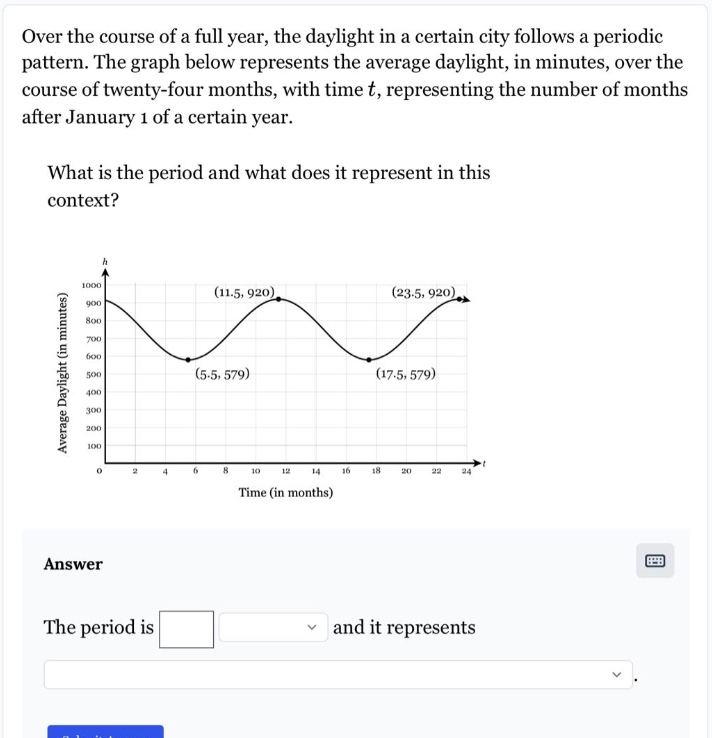
over the course of a full year, the daylight in a certain city follows a periodic pattern. the graph below represents the average daylight, in minutes, over the course of twenty - four months, with time t, representing the number of months after january 1 of a certain year.\nwhat is the period and what does it represent in this context?\nanswer\nthe period is and it represents
Answer
Explanation:
Step1: Identify period from graph
The period of a periodic function is the horizontal distance between two consecutive points with the same value and behavior. Looking at the graph, the points $(5.5, 579)$ and $(17.5, 579)$ are consecutive points with the same average - daylight value.
Step2: Calculate the period
The period $P$ is calculated as $P=17.5 - 5.5$. $P = 12$
Answer:
The period is $12$ months and it represents the time it takes for the average - daylight pattern to repeat itself. This means that the average amount of daylight in the city follows the same cycle every 12 months, which is one year.