over the course of a full year, the daylight in a certain city follows a periodic pattern. the graph below…
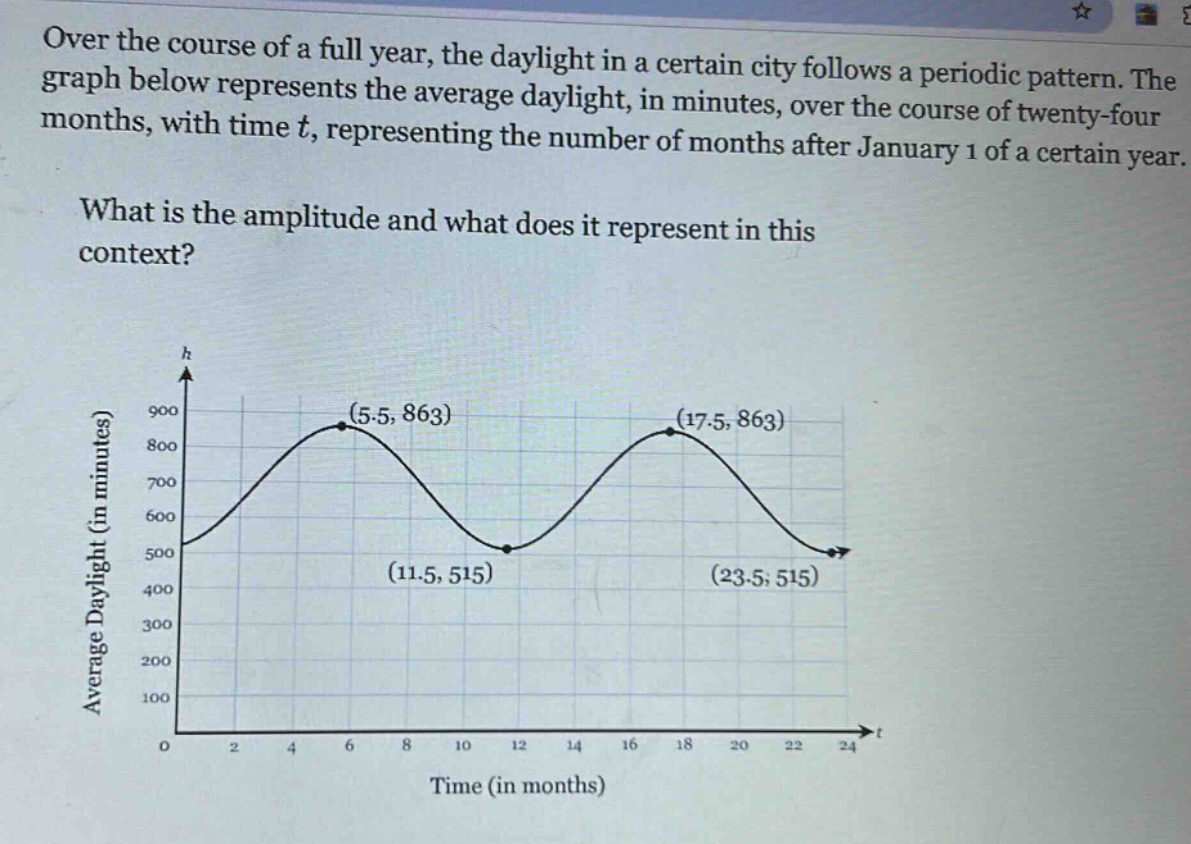
over the course of a full year, the daylight in a certain city follows a periodic pattern. the graph below represents the average daylight, in minutes, over the course of twenty - four months, with time t, representing the number of months after january 1 of a certain year. what is the amplitude and what does it represent in this context?
Answer
Explanation:
Step1: Recall amplitude formula
The amplitude $A$ of a periodic - function is given by $A=\frac{\text{Max}-\text{Min}}{2}$, where $\text{Max}$ is the maximum value and $\text{Min}$ is the minimum value of the function.
Step2: Identify Max and Min values
From the graph, the maximum value of the average daylight $\text{Max} = 863$ minutes and the minimum value $\text{Min}=515$ minutes.
Step3: Calculate the amplitude
$A=\frac{863 - 515}{2}=\frac{348}{2}=174$ minutes.
Step4: Interpret the amplitude
The amplitude represents half of the difference between the maximum and minimum average - daylight times. In this context, it represents the maximum deviation (in minutes) of the average daylight time from the mid - line value of the periodic pattern of daylight in the city.
Answer:
The amplitude is 174 minutes. It represents the maximum deviation of the average daylight time from the mid - line value of the periodic pattern of daylight in the city.