current attempt in progress the figure below shows the rate of change of a fish population. estimate the…
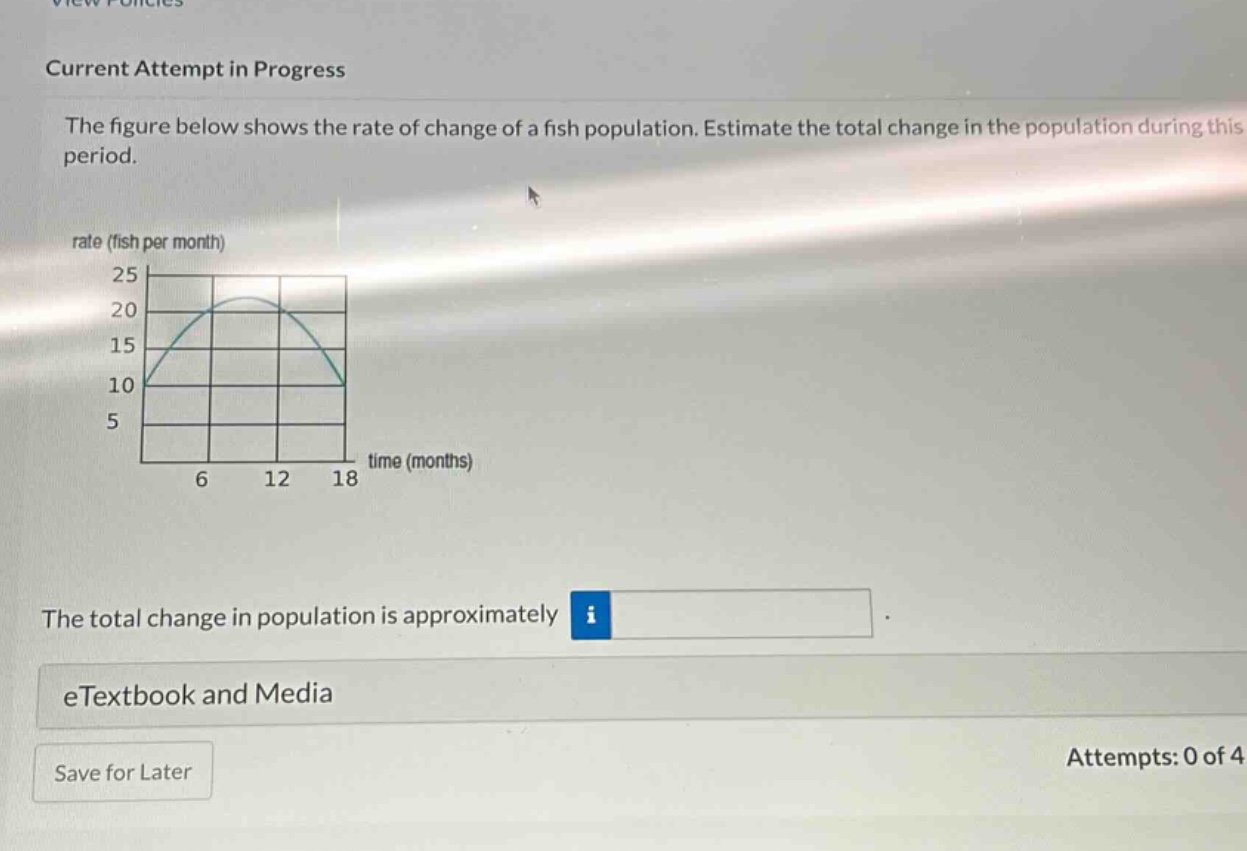
current attempt in progress the figure below shows the rate of change of a fish population. estimate the total change in the population during this period. rate (fish per month) 25 20 15 10 5 time (months) 6 12 18 the total change in population is approximately i etextbook and media save for later attempts: 0 of 4
Answer
Explanation:
Step1: Divide the area under the curve into rectangles
We can divide the 18 - month period into 3 sub - intervals of length 6 months each.
Step2: Estimate the height of rectangles
For the first sub - interval (0 - 6 months), we can estimate the average rate as $\frac{10 + 20}{2}=15$ fish per month. For the second sub - interval (6 - 12 months), the average rate is approximately 20 fish per month. For the third sub - interval (12 - 18 months), the average rate is $\frac{20+10}{2} = 15$ fish per month.
Step3: Calculate the change for each sub - interval
The change in population for the first sub - interval $\Delta P_1$ is $15\times6 = 90$ fish. The change in population for the second sub - interval $\Delta P_2$ is $20\times6=120$ fish. The change in population for the third sub - interval $\Delta P_3$ is $15\times6 = 90$ fish.
Step4: Calculate the total change
The total change $\Delta P=\Delta P_1+\Delta P_2+\Delta P_3=90 + 120+90=300$ fish.
Answer:
300