current attempt in progress\nthe table below shows the approximate rate r(t) in cases per day at which the…
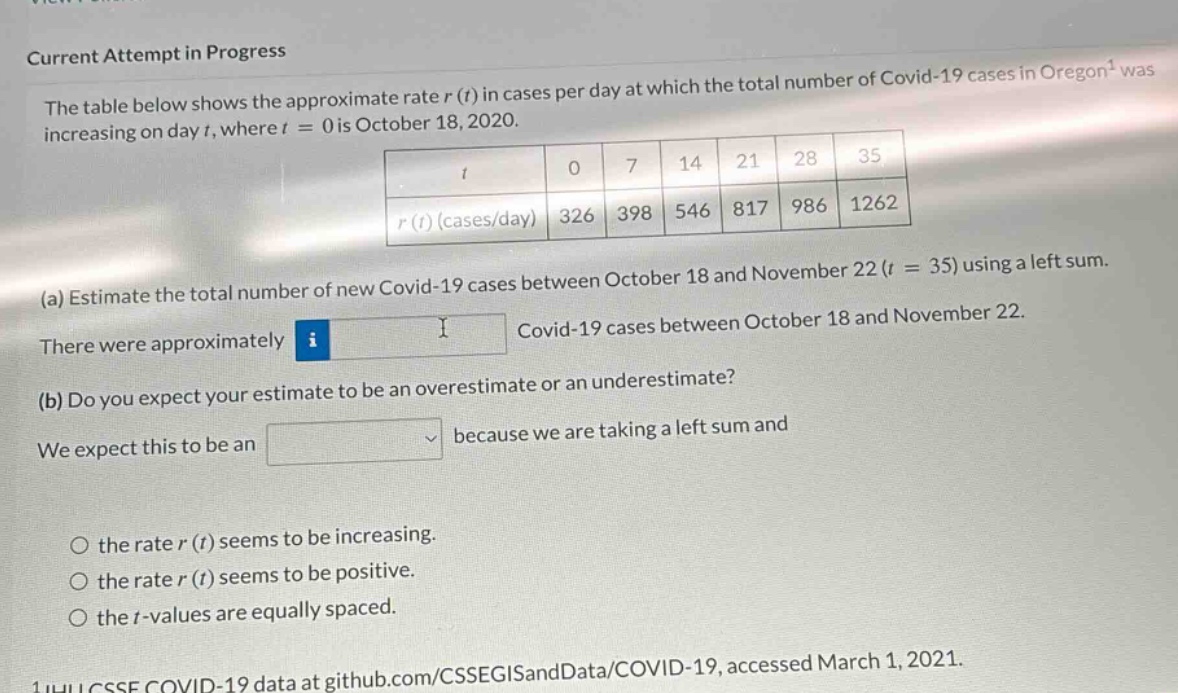
current attempt in progress\nthe table below shows the approximate rate r(t) in cases per day at which the total number of covid - 19 cases in oregon¹ was increasing on day t, where t = 0 is october 18, 2020.\n| t | 0 | 7 | 14 | 21 | 28 | 35 |\n| r(t) (cases/day) | 326 | 398 | 546 | 817 | 986 | 1262 |\n(a) estimate the total number of new covid - 19 cases between october 18 and november 22(t = 35) using a left sum.\nthere were approximately i i covid - 19 cases between october 18 and november 22.\n(b) do you expect your estimate to be an overestimate or an underestimate?\nwe expect this to be an \n the rate r(t) seems to be increasing.\n the rate r(t) seems to be positive.\n the t - values are equally spaced.\n1. hui cse covid - 19 data at github.com/csegisanddata/covid - 19, accessed march 1, 2021.
Answer
Explanation:
Step1: Identify the interval and values
The interval $\Delta t=7$, and the left - hand values for the sum are $r(0),r(7),r(14),r(21),r(28)$.
Step2: Apply the left - sum formula
The left - sum formula for approximating the integral $\int_{a}^{b}r(t)dt$ is $L=\sum_{i = 0}^{n - 1}r(t_i)\Delta t$. Here, $n = 5$, $\Delta t=7$, and $r(t_0)=326$, $r(t_1)=398$, $r(t_2)=546$, $r(t_3)=817$, $r(t_4)=986$. [ \begin{align*} L&=7\times(326 + 398+546+817+986)\ &=7\times(300 + 26+400 - 2+500+46+800+17+900+86)\ &=7\times(300+400+500+800+900+(26 - 2+46+17+86))\ &=7\times(2900 + 173)\ &=7\times3073\ &=21511 \end{align*} ]
Step3: Determine over/under - estimate
Since the rate $r(t)$ is increasing, when we use a left - sum, we are using the smaller values of the rate function on each sub - interval. So, the left - sum is an underestimate.
Answer:
(a) 21511 (b) underestimate; the rate $r(t)$ seems to be increasing.