a curve is defined by the parametric equations x(t)=6cos(t) and y(t)=5sin(t)+3. follow prompts below to…
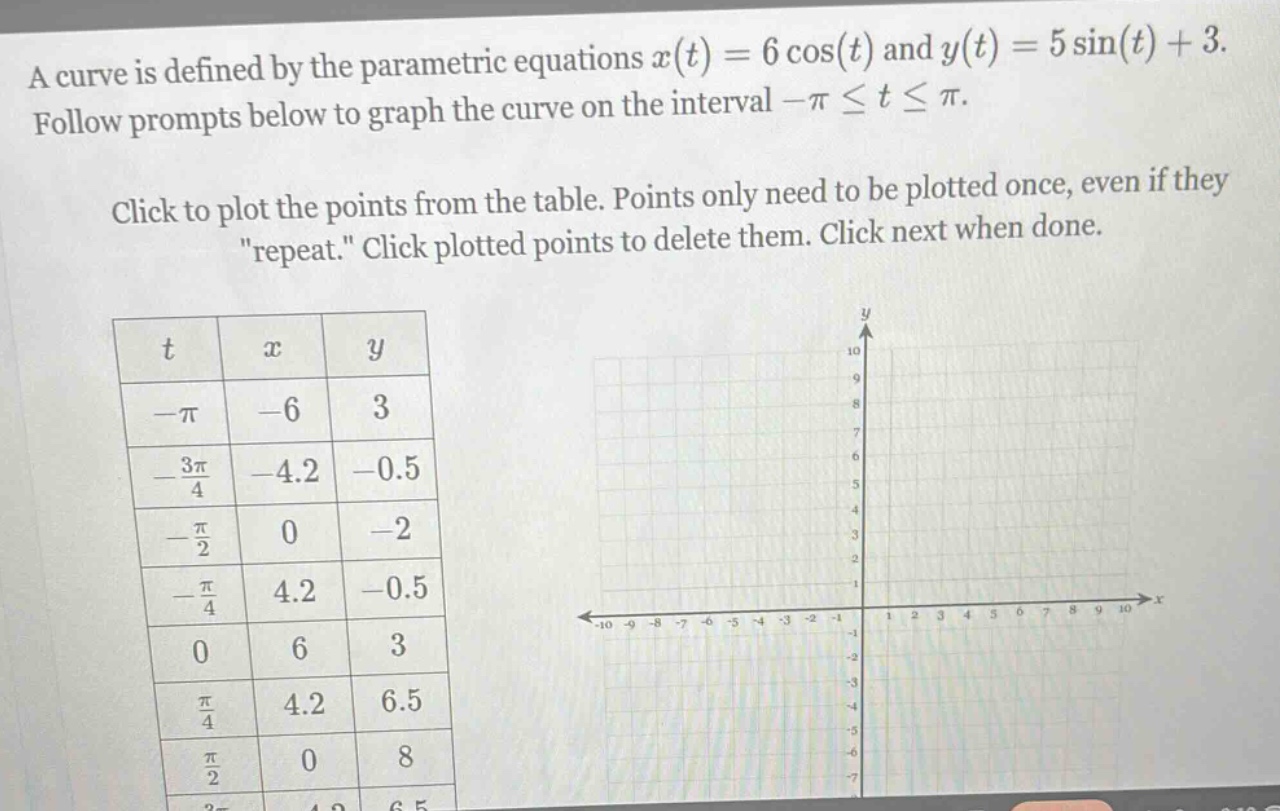
a curve is defined by the parametric equations x(t)=6cos(t) and y(t)=5sin(t)+3. follow prompts below to graph the curve on the interval -π≤t≤π. click to plot the points from the table. points only need to be plotted once, even if they \repeat.\ click plotted points to delete them. click next when done. t x y -π -6 3 -3π/4 -4.2 -0.5 -π/2 0 -2 -π/4 4.2 -0.5 0 6 3 π/4 4.2 6.5 π/2 0 8
Answer
Explanation:
Step1: Identify the points
We are given a table of (t), (x = 6\cos(t)), and (y=5\sin(t)+3) values for different (t) - values in the interval ([-\pi,\pi]).
Step2: Plot the points
On the (x - y) coordinate - plane, for each row in the table, we plot the point ((x,y)). For example, when (t =-\pi), (x=-6) and (y = 3), so we plot the point ((-6,3)); when (t=-\frac{3\pi}{4}), (x\approx - 4.2) and (y\approx - 0.5), so we plot the point ((-4.2,-0.5)) and so on.
Step3: Connect the points
After plotting all the points from the table, we connect them with a smooth curve to graph the parametric equations (x(t)=6\cos(t)) and (y(t)=5\sin(t)+3) on the interval ([-\pi,\pi]).
Answer:
Plot the points ((-6,3),(-4.2,-0.5),(0, - 2),(4.2,-0.5),(6,3),(4.2,6.5),(0,8)) from the table on the (x - y) coordinate - plane and connect them with a smooth curve.