the curve above is the graph of a sinusoidal function. it goes through the points (-9,-2) and (1,-2). find a…
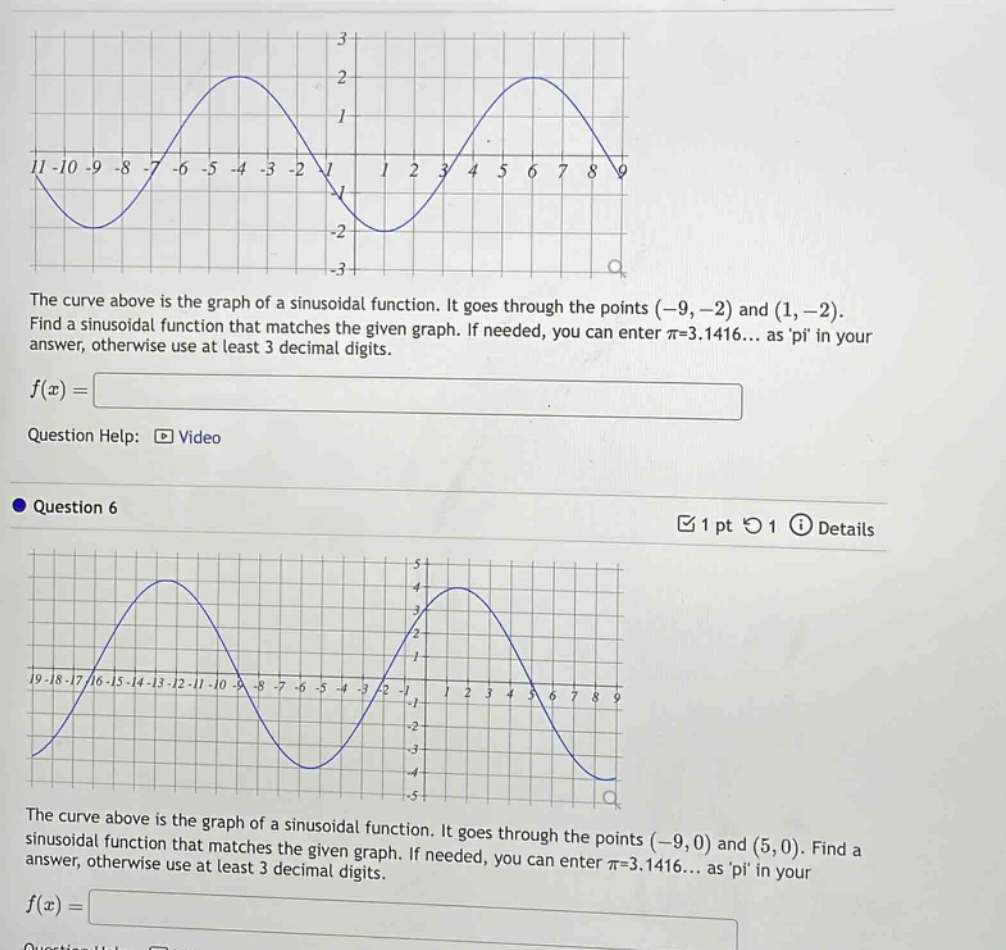
the curve above is the graph of a sinusoidal function. it goes through the points (-9,-2) and (1,-2). find a sinusoidal function that matches the given graph. if needed, you can enter π=3.1416... as pi in your answer, otherwise use at least 3 decimal digits. f(x)= question help: video question 6 1 pt 1 details the curve above is the graph of a sinusoidal function. it goes through the points (-9,0) and (5,0). find a sinusoidal function that matches the given graph. if needed, you can enter π=3.1416... as pi in your answer, otherwise use at least 3 decimal digits. f(x)=
Answer
Explanation:
Step1: Determine the period
The distance between two consecutive points with the same value (e.g., the two - 2 values in the first graph: $x=-9$ and $x = 1$) gives half of the period. For the first graph, half - period $T/2=1-(-9)=10$, so $T = 20$. For the second graph, the distance between $x=-9$ and $x = 5$ (two consecutive x - intercepts) gives half of the period, $T/2=5-(-9)=14$, so $T = 28$. The general form of a sinusoidal function is $y = A\sin(B(x - C))+D$ or $y=A\cos(B(x - C))+D$, and $B=\frac{2\pi}{T}$. For the first graph, $B=\frac{2\pi}{20}=\frac{\pi}{10}$, for the second graph, $B=\frac{2\pi}{28}=\frac{\pi}{14}$.
Step2: Determine the amplitude
For the first graph, the maximum value is 2 and the minimum value is - 2. The amplitude $A=\frac{2-(-2)}{2}=2$. For the second graph, the maximum value is 4 and the minimum value is - 4, so the amplitude $A = 4$.
Step3: Determine the vertical shift
For the first graph, the mid - line is $y = 0$ (since the maximum is 2 and the minimum is - 2), so $D = 0$. For the second graph, the mid - line is $y = 0$ (since the maximum is 4 and the minimum is - 4), so $D = 0$.
Step4: Determine the phase shift
For the first graph, we can assume a sine function of the form $y = A\sin(B(x - C))+D$. Let's use the point $(-9,-2)$. Substituting $A = 2$, $B=\frac{\pi}{10}$, $x=-9$, $y=-2$ and $D = 0$ into $y = A\sin(B(x - C))+D$ gives $-2=2\sin(\frac{\pi}{10}(-9 - C))$. Then $\sin(\frac{\pi}{10}(-9 - C))=-1$. $\frac{\pi}{10}(-9 - C)=-\frac{\pi}{2}+2k\pi,k\in\mathbb{Z}$. Solving for $C$: $-9 - C=-5 + 20k$, $C=-4+20k$. Let $k = 0$, then $C=-4$. So the function is $y = 2\sin(\frac{\pi}{10}(x + 4))$. For the second graph, using the point $(-9,0)$ and $y = A\sin(B(x - C))+D$ with $A = 4$, $B=\frac{\pi}{14}$, $D = 0$. $0=4\sin(\frac{\pi}{14}(-9 - C))$. Then $\frac{\pi}{14}(-9 - C)=k\pi,k\in\mathbb{Z}$. Let $k = 0$, $C=-9$. So the function is $y = 4\sin(\frac{\pi}{14}(x + 9))$.
Answer for the first graph:
$2\sin(\frac{\pi}{10}(x + 4))$
Answer for the second graph:
$4\sin(\frac{\pi}{14}(x + 9))$