describing the change of a graph\nhow does this graph change between (2.5, 2) and (4.5, 0.25)?
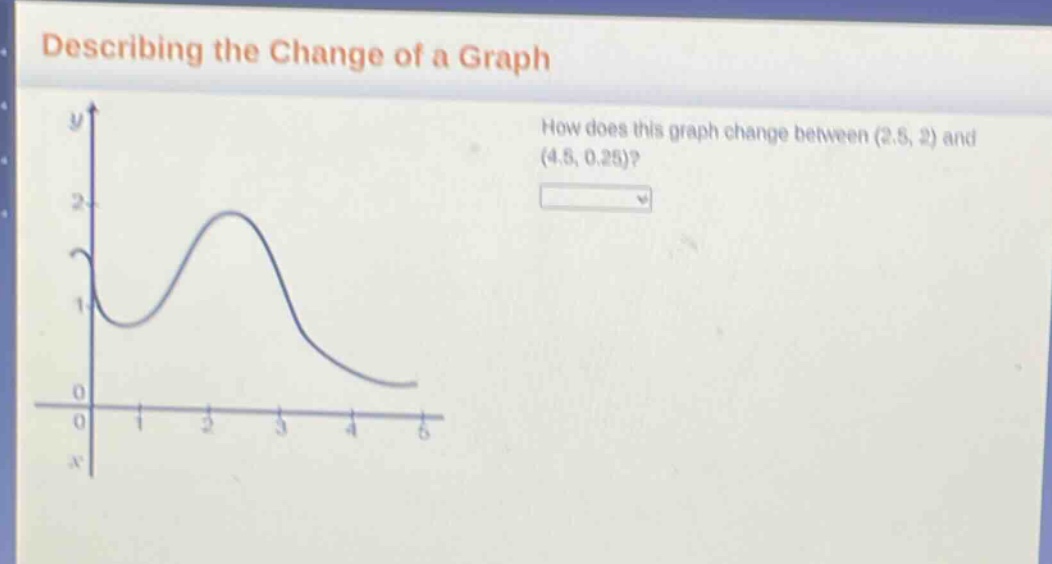
describing the change of a graph\nhow does this graph change between (2.5, 2) and (4.5, 0.25)?
Answer
Explanation:
Step1: Identify the given points on the graph.
The first point is $P_1 = (x_1, y_1) = (2.5, 2)$. The second point is $P_2 = (x_2, y_2) = (4.5, 0.25)$.
Step2: Analyze the change in the x-coordinates.
The x-coordinate changes from $x_1 = 2.5$ to $x_2 = 4.5$. Since $4.5 > 2.5$, the x-coordinate increases.
Step3: Analyze the change in the y-coordinates.
The y-coordinate changes from $y_1 = 2$ to $y_2 = 0.25$. Since $0.25 < 2$, the y-coordinate decreases.
Step4: Determine how the graph changes.
As the x-value increases from $2.5$ to $4.5$, the corresponding y-value decreases from $2$ to $0.25$. This indicates that the graph is decreasing between these two points. Visual inspection of the graph confirms that the curve slopes downwards from $x=2.5$ to $x=4.5$.
Answer:
Decreasing