draw a graph of f(x) = x / (x + 1) by first placing the horizontal and vertical asymptotes, then plotting an…
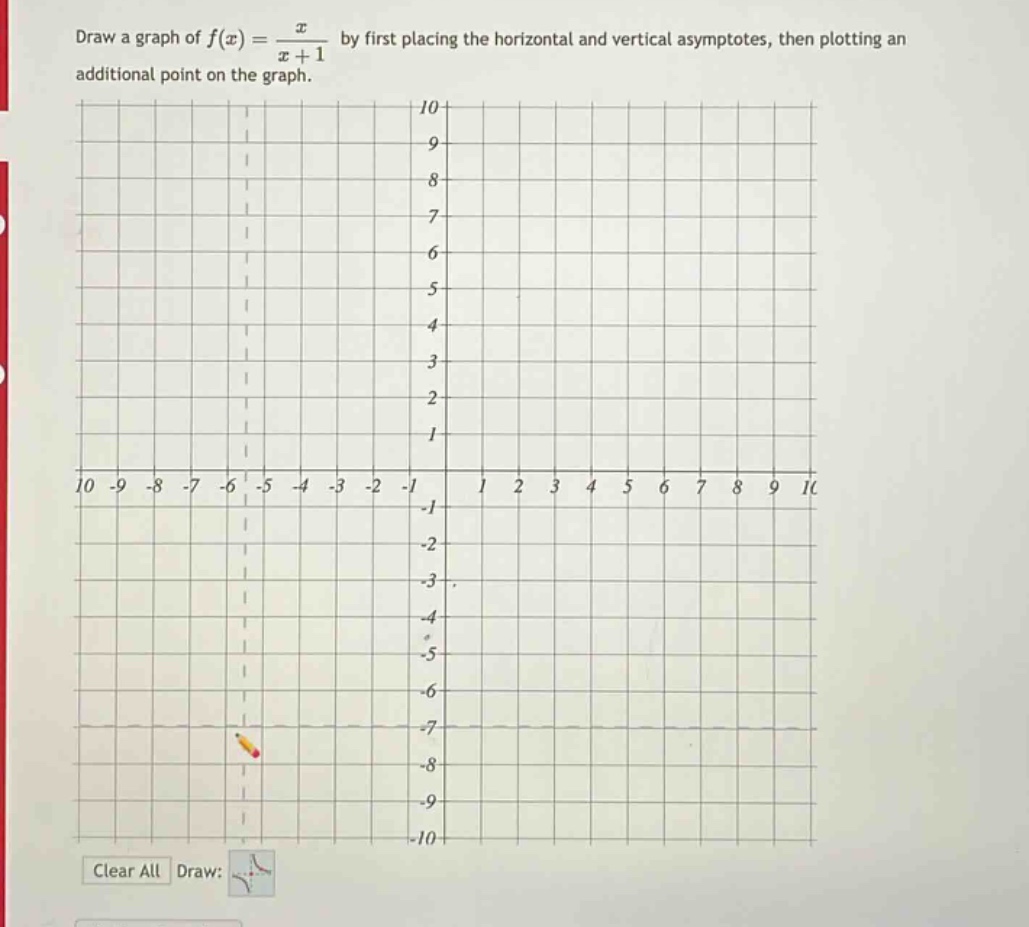
draw a graph of f(x) = x / (x + 1) by first placing the horizontal and vertical asymptotes, then plotting an additional point on the graph. clear all draw:
Answer
Explanation:
Step1: Find vertical asymptote
Set denominator equal to 0. $x + 1=0$, so $x=-1$ is vertical asymptote.
Step2: Find horizontal asymptote
Degree of numerator and denominator is 1. Divide leading - coefficients. $\lim_{x\rightarrow\pm\infty}\frac{x}{x + 1}=\lim_{x\rightarrow\pm\infty}\frac{1}{1+\frac{1}{x}} = 1$, so $y = 1$ is horizontal asymptote.
Step3: Find an additional point
Let $x = 0$, then $f(0)=\frac{0}{0 + 1}=0$. So the point $(0,0)$ is on the graph.
To draw the graph:
- Draw the vertical asymptote $x=-1$ as a dashed line.
- Draw the horizontal asymptote $y = 1$ as a dashed line.
- Plot the point $(0,0)$.
- Sketch the two branches of the hyperbola approaching the asymptotes.
Answer:
Graph with vertical asymptote $x=-1$, horizontal asymptote $y = 1$ and point $(0,0)$ plotted and hyperbola branches sketched approaching asymptotes.