the entire graph of the function $h$ is shown in the figure below.\nwrite the domain and range of $h$ using…
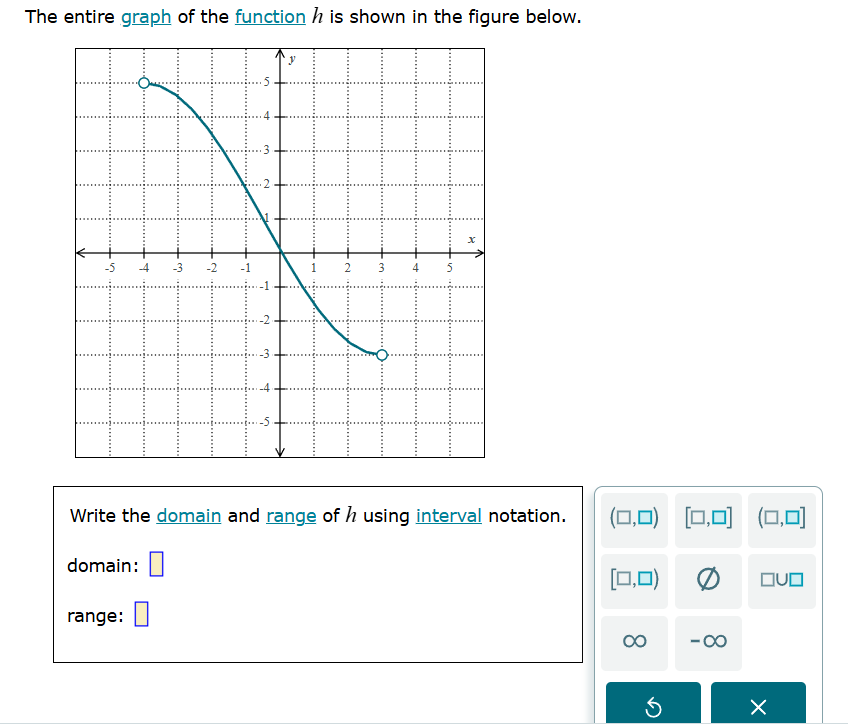
the entire graph of the function $h$ is shown in the figure below.\nwrite the domain and range of $h$ using interval notation.\ndomain: \nrange:
Answer
Answer:
domain: $(-4, 3)$ range: $(-3, 5)$
Explanation:
Step1: Identify the domain from the graph.
The domain of a function refers to all possible input values (x-values) for which the function is defined. Looking at the graph, the function starts at $x = -4$ and ends at $x = 3$. The open circles at these endpoints indicate that these values are not included in the domain. Therefore, the domain is $(-4, 3)$.
Step2: Identify the range from the graph.
The range of a function refers to all possible output values (y-values) that the function can produce. Looking at the graph, the lowest y-value the function reaches is $y = -3$ and the highest y-value it reaches is $y = 5$. The open circles at these endpoints indicate that these values are not included in the range. Therefore, the range is $(-3, 5)$.