escribir la ecuación de una función seno o coseno para describir el gráfico.
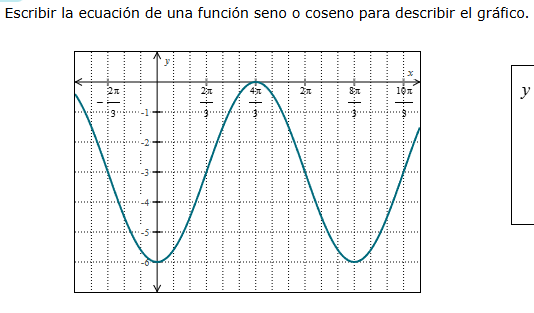
escribir la ecuación de una función seno o coseno para describir el gráfico.
Answer
Explanation:
Step1: Determine the amplitude $A$
The maximum value is $0$ and the minimum value is $-6$. $$A = \frac{\text{max} - \text{min}}{2} = \frac{0 - (-6)}{2} = 3$$
Step2: Determine the vertical shift $D$
The vertical shift is the average of the maximum and minimum values. $$D = \frac{\text{max} + \text{min}}{2} = \frac{0 + (-6)}{2} = -3$$
Step3: Determine the period $P$ and frequency $B$
The distance between two consecutive peaks (at $x = \frac{4\pi}{3}$ and $x = \frac{10\pi}{3}$) is the period. $$P = \frac{10\pi}{3} - \frac{4\pi}{3} = \frac{6\pi}{3} = 2\pi$$ $$B = \frac{2\pi}{P} = \frac{2\pi}{2\pi} = 1$$
Step4: Determine the phase shift $C$
Using a cosine function $y = A\cos(B(x - C)) + D$, the peak is at $x = \frac{4\pi}{3}$. $$C = \frac{4\pi}{3}$$
Step5: Construct the final equation
Substitute $A=3$, $B=1$, $C=\frac{4\pi}{3}$, and $D=-3$ into the cosine model. $$y = 3\cos\left(x - \frac{4\pi}{3}\right) - 3$$
Answer:
$y = 3\cos\left(x - \frac{4\pi}{3}\right) - 3$