estimate the area under the graph of f(x)=x² + 2x from x = 3 to x = 7 using 4 approximating rectangles and…
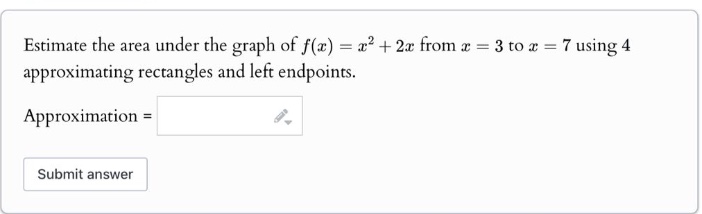
estimate the area under the graph of f(x)=x² + 2x from x = 3 to x = 7 using 4 approximating rectangles and left endpoints. approximation =
Answer
Explanation:
Step1: Calculate the width of each rectangle
The interval is from $a = 3$ to $b = 7$, and $n=4$. The width $\Delta x=\frac{b - a}{n}=\frac{7 - 3}{4}=1$.
Step2: Determine the left - endpoints
The left - endpoints of the 4 sub - intervals are $x_0 = 3,x_1=4,x_2 = 5,x_3=6$.
Step3: Evaluate the function at the left - endpoints
$f(x_0)=f(3)=3^{2}+2\times3=9 + 6=15$. $f(x_1)=f(4)=4^{2}+2\times4=16 + 8=24$. $f(x_2)=f(5)=5^{2}+2\times5=25 + 10=35$. $f(x_3)=f(6)=6^{2}+2\times6=36+12 = 48$.
Step4: Calculate the area of the approximating rectangles
The area of the approximating rectangles using left - endpoints is $A=\sum_{i = 0}^{3}f(x_i)\Delta x$. Since $\Delta x = 1$, we have $A=f(x_0)\times1+f(x_1)\times1+f(x_2)\times1+f(x_3)\times1$. $A=15 + 24+35+48=122$.
Answer:
$122$