evaluate the function graphically.
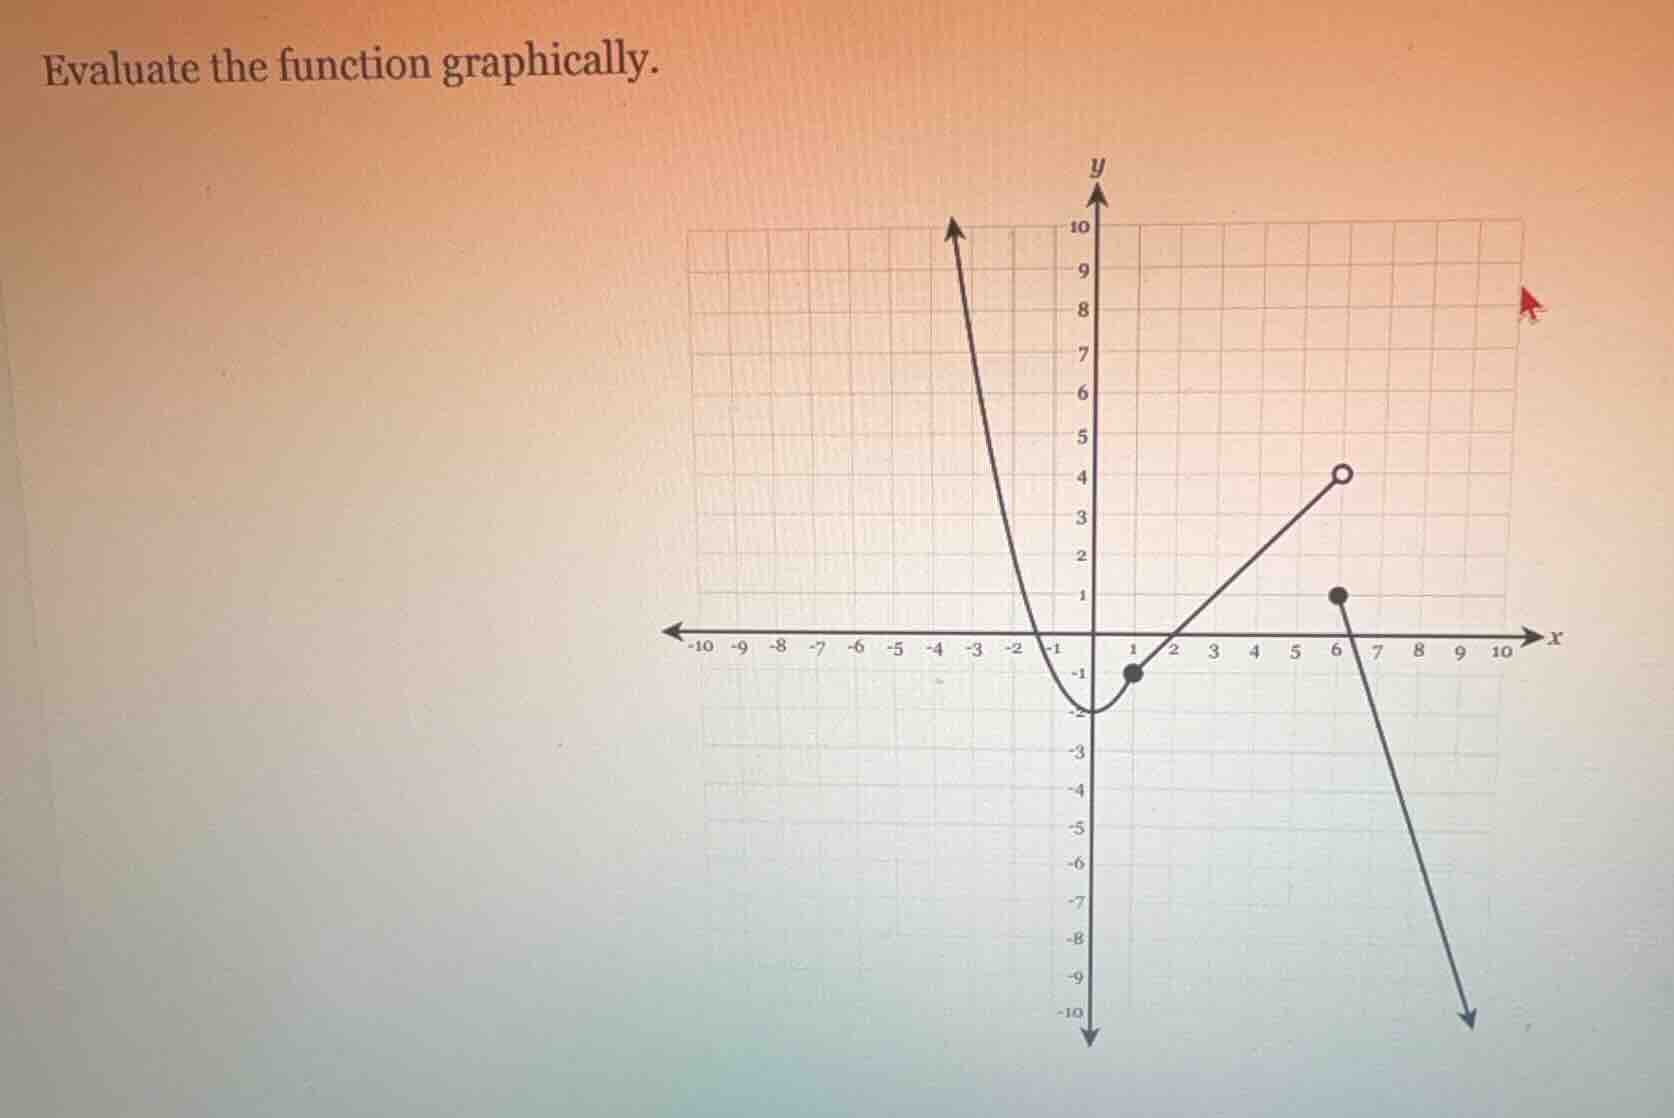
evaluate the function graphically.
Answer
To evaluate the function graphically, we typically need to find the value of the function at a specific ( x )-value (e.g., ( f(a) ) for some ( a )). Since the problem statement is incomplete (it doesn't specify which ( x )-value to evaluate the function at), we can't provide a full solution. However, here's the general method:
Step 1: Identify the ( x )-value
Suppose we want to find ( f(x) ) at a specific ( x = a ). Locate ( x = a ) on the ( x )-axis.
Step 2: Find the corresponding ( y )-value
From ( x = a ), move vertically (up or down) until you intersect the graph of the function. The ( y )-coordinate of that intersection point is ( f(a) ).
For example, if we want to find ( f(1) ):
- Locate ( x = 1 ) on the ( x )-axis.
- Move up until we hit the graph. The point at ( x = 1 ) has a ( y )-coordinate of ( -1 ) (from the filled dot at ( (1, -1) )). So ( f(1) = -1 ).
If we want to find ( f(6) ):
- Locate ( x = 6 ) on the ( x )-axis.
- Move up until we hit the graph. The filled dot at ( x = 6 ) has a ( y )-coordinate of ( 1 ), so ( f(6) = 1 ).
If we want to find ( f(5) ):
- Locate ( x = 5 ) on the ( x )-axis.
- Move up until we hit the graph. The open dot at ( x = 5 ) has a ( y )-coordinate of ( 4 ), but since it's an open dot, the function is not defined there (or has a different value, but the open dot indicates a discontinuity).
Please provide the specific ( x )-value for which you want to evaluate the function, and we can give the exact answer.