explain how to sketch a graph of the function $f(x)=x^{3}+2x^{2}-8x$. be sure to include end - behavior…
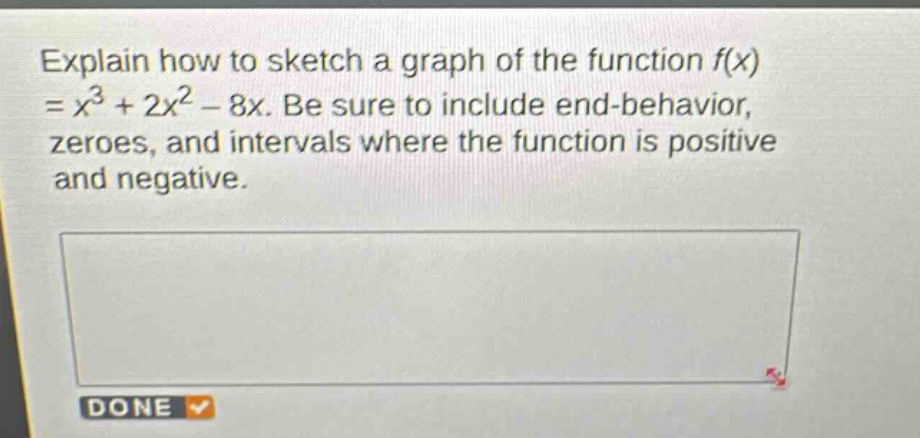
explain how to sketch a graph of the function $f(x)=x^{3}+2x^{2}-8x$. be sure to include end - behavior, zeroes, and intervals where the function is positive and negative.
Answer
Explanation:
Step1: Analyze the end - behavior
For a polynomial function (f(x)=a_nx^n+\cdots+a_0), here (n = 3) (odd) and (a_n=1>0). As (x\to+\infty), (y = f(x)\to+\infty) (because (y=x^{3}(1+\frac{2}{x}-\frac{8}{x^{2}})) and (\lim_{x\to+\infty}(1+\frac{2}{x}-\frac{8}{x^{2}})=1)). As (x\to-\infty), (y = f(x)\to-\infty) (because (y=x^{3}(1+\frac{2}{x}-\frac{8}{x^{2}})) and (\lim_{x\to-\infty}(1+\frac{2}{x}-\frac{8}{x^{2}})=1)).
Step2: Find the zeroes
Factor the function: (f(x)=x(x^{2}+2x - 8)=x(x + 4)(x-2)). Set (f(x)=0), then (x=0), (x=-4), (x = 2).
Step3: Determine the intervals of positivity and negativity
Use test - points in the intervals ((-\infty,-4)), ((-4,0)), ((0,2)) and ((2,\infty)).
- For the interval ((-\infty,-4)), let (x=-5). Then (f(-5)=(-5)(-5 + 4)(-5-2)=(-5)(-1)(-7)=-35<0).
- For the interval ((-4,0)), let (x=-1). Then (f(-1)=(-1)(-1 + 4)(-1-2)=(-1)(3)(-3)=9>0).
- For the interval ((0,2)), let (x = 1). Then (f(1)=(1)(1 + 4)(1-2)=(1)(5)(-1)=-5<0).
- For the interval ((2,\infty)), let (x=3). Then (f(3)=(3)(3 + 4)(3-2)=(3)(7)(1)=21>0).
Answer:
The end - behavior: as (x\to+\infty), (y\to+\infty); as (x\to-\infty), (y\to-\infty). The zeroes are (x=-4), (x = 0), (x=2). The function is negative on ((-\infty,-4)\cup(0,2)) and positive on ((-4,0)\cup(2,\infty)). To sketch the graph, plot the (x) - intercepts at ((-4,0)), ((0,0)) and ((2,0)). Use the end - behavior to draw the left and right ends of the graph and consider the sign of the function in each sub - interval.